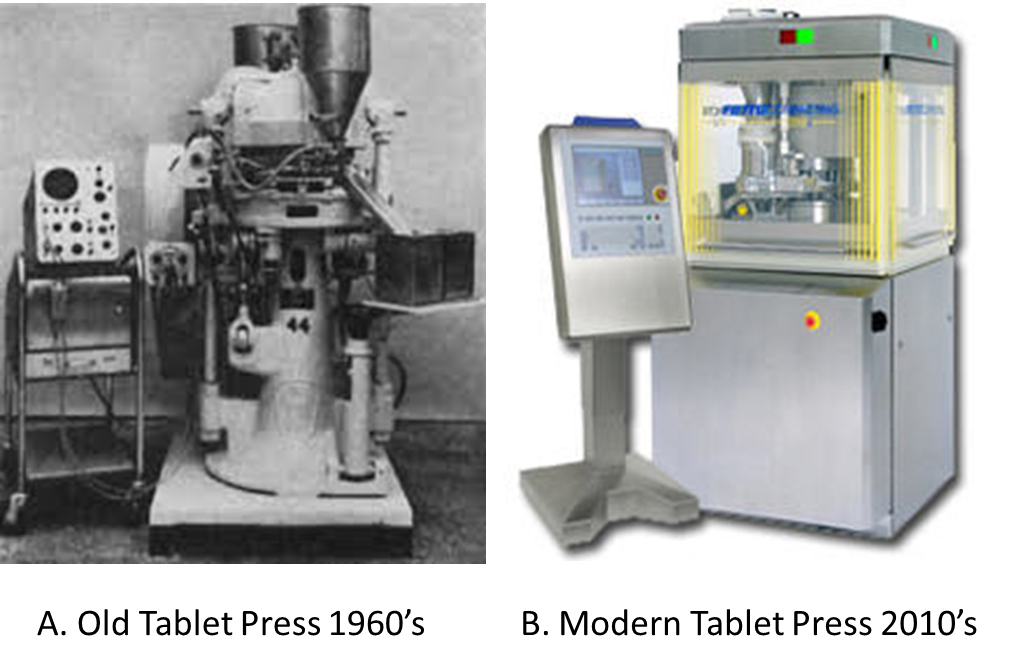
Introduction
The manufacturing and supply of generic drugs need a transformation for its sustainability, quality, manufacturing modernization, supply reliability, and affordability. The best way to reach this transformation is by using pharmaceutical technologies advancement and innovation. This innovation strategy provides the basis of this transformation of generic medicines tailored to any generic manufacturer.
The generic market; a typical company.
What technology-driven opportunities lie for a generic manufacturer? Are they considering the supply reliability, quality, manufacturing modernization, and sustainability needs of generic medicines?
Typically, generic companies do not entertain much effort in introducing technology. A traditional generic company SWOT analysis revealed some concerns with respect to business model threats. The main threat of a generic manufacturer business model consists of the risk brought by the medicines affordable act, or the health care reform act (US Senate, 2018). This threat reveals the need from generic manufacturers to control cost to ensure competitive prices and the allowance for Medicare rebates mandated by the US government. Besides the medicines affordability congress initiatives other business liabilities include those related to the company’s manufacturing practices and cGMP compliance issues (Saumya & Aakash, 2019, Food & Drug Administration, 2018, and West, 2018). Nevertheless, with all these business treats of generic companies, are these companies a good target for an innovation strategy like the one described in this article?
Innovation project
design.
The innovation strategy described in this article is an elongation of the innovation process design previously posted on my blog (Sánchez-Rolón, 2020). In summary, the innovation consists of changing dramatically the pharmaceutical process of generic tablets and capsules in a way that permits manufacturing in a distributed form. The latest progress in pharmaceutical manufacturing technology based on continuous manufacturing and spectrophotometric analytical technologies enables this transformation. These technologies permit the manufacturing of drug products near to the point of dispensing, at the pharmacies and hospitals, which allows for a dramatic reduction of the manufacturing/packaging operations, analytical, and supply chain costs.
The hypothesis of this innovation strategy is that the economies of scale which traditionally enforces the use of complex supply chains and centralized manufacturing may have a higher cost than a technology-based regionally distributed manufacturing where the competencies of reduced operational cost, shrink supply chain, inventories controls, and quality-related cost can result in a better economical makeup. In addition, this new way of making medicines allows for the opportunity for the development of safer and better performing dosing regimes which opens an innovation path for new products that require this type of technology at an affordable cost.
The innovation
strategy for a new way of making medicines.
Under economic favorable or unfavorable conditions, innovation strategies prove to be a source of differentiation, and proficiency of companies on their competitive advantage (Cooper & Edgett, 2010, Bowonder, Dambal, Kumar, & Shirodkar, 2010, and Bodley-Scott, 2011). Innovation strategy preparation and implementation require a deep evaluation process full of market evaluation insight, evaluation of the business environment, and abundant skillset portfolios (Cooper & Edgett, 2010, and Bowonder et al., 2010). Creating a new way of making medicines, certainly requires a finetuned innovation strategy. This article proposes an innovation strategy for this goal based mainly on Cooper and Edgett (2010) innovation strategy framework.
Why humanity needs a new way of making medicines? Sánchez-Rolón (2020) provided a definition of why humanity needs a new way of making medicines. In short, there are five reasons why this project makes a wonderful contribution to humanity.
Humanity needs a new
way of making medicines because:
- Medicines should be manufacture
with high quality every time - Medicines should be affordable
for all. - Medicines should always be
available. - Medicines should be made safe and
effective for each person. - Medicines making should be
sustainable
Goals and objectives. An innovation strategy starts with a well-defined set of goals, which are the general intentions of the business innovation program. The objectives on the other hand are the specific, narrowly defined, and concrete actions needed to achieve those goals (Cooper & Edgett, 2010). Table 1 summarizes this project’s goals and objectives. The five reasons why we need a new way of making medicines are the goals of this innovation project. Table 1 provides specific objectives for each goal.

Strategic arenas
and areas of focus: The goals and their specific objectives
defines three main arenas of action and definition of attack strategies. These
arenas are:
- The supply chain transformation
process.
Although the action of creating a distributed manufacturing that is near to the point of use appears as logic and simple solution to the quality, affordability, availability, safety/efficacy, and sustainability of medicines making, there is a huge challenge on defining the new supply chain design and how the materials will be made available at the right configuration, amounts and fulfilling all safety and industrial hygiene requirements. This is an important area of focus to make this project a successful one.
- The technology advances on
materials sciences.
The current level of knowledge in materials sciences for pharmaceutical structured organic particulate systems had made significant advances in the latest years, specifically on the understanding of material properties effect on solid dosage formulations and processing (Oka, Sahay, Meng & Muzzio, 2017, Grigorov, Glasser & Muzzio, 2016, Grigorov, Glasser & Muzzio, 2013, Muzzio, Glasser & Grigorov, 2018, and Grigorov, Muzzio & Glasser, 2019). This knowledge enables a different way of using materials properties to fulfill the goals of this project in the stabilization and processability of materials to obtain the desired effect on product quality and consistency of manufacturing.
- The technology advances on the machine that makes medicines that do not exist.
This project requires a significant advance on medicines making to support the new way of making them at the user’s specific needs. Personalized medicines are those medicines that require specific dosing regimes that are distinct from the regular fixed-dose typically used in pharmaceutical prescriptions (Archer, 2019). Making medicines this way requires a completely different makeup of equipment, systems, and logistics that needs to be designed and built.
- The technology enabling sustainability of the process
Finally, the technological changes proposed for this innovation strategy will enable the sustainability of pharmaceutical manufacturing from the societal, economic, and environmental perspectives.
Attack Strategy. This innovation attack strategy starts with a leadership positioning, specifically for the development of the micro-manufacturing machine. The cost differentiation will come from the transformation of the supply chain and the economies related to avoiding markup of the multiple touchpoints of the supply chain and the operational cost reductions. This project has a clearly global benefit scope, nevertheless, the US domestic market represents the largest opportunity. The proposal for the technology development includes the use of an open innovation approach with a University consortia lead by UPR Mayaguez, and include the UPR School of Pharmacy and Rutgers University.
Deployment strategy. This strategy deployment will require a significant investment inxxx a multi-year, multi-functional project management approach. The project deployment can be defined in four major areas.
- The technology development stage, which includes the mechanical and systems integration of the micro-manufacturing robotic machine that will manufacture products at the pharmacy setting.
- The formulation and materials science transformation, which includes the aspect related to the development of the materials dispensing technology that will enable the manufacturing at the pharmacy setting.
- The supply chain transformation modeling which requires a significant effort designing the new elements of the supply chain that requires the manufacturing at the pharmacy setting.
- Finally, the evaluation and approval process by the health authorities in the countries where the technology will operate.
Figure 1 provides a graphical representation of this innovation implementation plan. This technology implementation should take approximately 5 years at the end of which a working prototype will be shared with customers for further refinement before implementation.

Figure 1. Strategic roadmap for the new way of making medicines
Conclusion
The modernization of generic manufacturing is an imperative long-awaited by the US FDA (Gottlieb & Woodcock, 2019). This public health imperative requires the attention of pharmaceutical companies, particularly generics manufacturers. Medicines affordability, availability, quality, safety, and efficacy as well as manufacturing sustainability are achievable through technology applications that are at the reach of these companies. This innovation shall provide any generics manufacturer an edge into the realization of these goals and the creation of a new way of making medicines.
References
Archer, R. (2015).
Precision medicine; imprecise manufacturing and supply. The Medicine Maker.
Retrieved from https://themedicinemaker.com/manufacture/precision-medicine-imprecise-manufacturing-and-supply
Bodley-Scott, S. (2011). Linking
innovation to strategy. Training Journal, , 64-66. Retrieved
from http://library.capella.edu/login?qurl=https%3A%2F%2Fsearch.proquest.com%2F
docview%2F855805008%3Facc
Bowonder, B., Dambal, A., Kumar, S.,
& Shirodkar, A. (2010). Innovation strategies for creating competitive
advantage. Research Technology
Management, 53(3), 19-32. Retrieved from http://library.capella.edu/login?qurl=https%3A%2F%2Fsearch.proquest.com%2Fdocview%2F506410190%3Fa
Cooper, R. G., & Edgett, S. J.
(2010). Developing a product innovation and technology strategy for your
business. Research Technology Management, 53(3), 33-40. Retrieved from http://library.capella.edu/login?qurl=https%3A%2F%2Fsearch.proquest.com%2Fdocview%2F506430810%3Faccou
Food & Drug Administration (2018, Nov 9th). Warning
letter, Mylan Pharmaceuticals, Inc. U.S. Food and Drug Administration.
Retrieved from https://www.fda.gov/inspections-compliance-enforcement-and-criminal-investigations/warning-letters/mylan-pharmaceuticals-inc-557903-11092018
Gottlieb, S. and
Woodcock, J. (2019). FDA is advancing new efforts to address drug shortages.
FDA web page blog, retrieved from https://www.fda.gov/NewsEvents/Newsroom/
FDAVoices/ucm626108.htm
Grigorov, P. I.; Glasser, B. J.; Muzzio, F. J. (2016).
Improving dissolution kinetics of pharmaceuticals by fluidized bed impregnation
of active pharmaceutical ingredients. AIChE Journal, 62 (12), 4201-4214.
Grigorov, P. I.; Glasser, B. J.; Muzzio, F. J. (2013).
Formulation and manufacture of pharmaceuticals by fluidized-bed impregnation of
active pharmaceutical ingredients onto porous carriers. AIChE Journal,
59 (12), 4538-4552.
Grigorov, P. I.; Muzzio, F. J.; Glasser, B. J. (2019).
Modeling fluidized bed impregnation of active pharmaceutical ingredients onto
porous excipients. Chemical Engineering Science, 202, 36-54.
US Senate (2018). Affordable
medications act. US Senate bill S.3411. Retrieved from https://www.congress.gov/bill/115th-congress/senate-bill/3411/text?format=txt
Muzzio, F. J.; Glasser, B. J.; Grigorov, P. I. (2018).
Formulation and manufacture of pharmaceuticals by impregnation onto porous
carriers. U.S. patent 10,004,682B2, 2018.
Oka, S.; Sahay, A.;
Meng, W.; Muzzio, F. (2017). Diminished segregation in continuous powder
mixing. Powder Technol 309, 79-88.
Saumya, J. and Aakash, B. (2019). Mylan gives no
clear view on strategic options, shares plunge 17 percent. Reuters.
Retrieved from https://www.reuters.com/article/us-mylan-nl-results/mylan-gives-no-clear-view-on-strategic-options-shares-plunge-17-percent-idUSKCN1SD1H0
Sánchez-Rolón, E.J. (2020). An innovation process design for
a new way of making medicines. Capella University Course BMGT 8136, Unit 7
Assignment. Retrieved from https://itradeandinvest.com/2020/06/16/an-innovation-process-design-for-a-new-way-of-making-medicines/
West,
T. (2018). Concern over Concerta. The Being Well Center. Retrieved from https://beingwellcenter.wordpress.com/2018/03/23/concern-over-concerta/
Introduction
This paper describes an innovation process design for a pharmaceutical manufacturing innovation project which intends to transform the supply of generic medicines to allow a sustainable, eco-friendly, and decentralized manufacturing. Research performed on intra-organizational processes, clusters of innovation, and customer engagement in new product design provided the theoretical framework for this innovation process design. The product of this paper will be part of an NSF grant request on Future Manufacturing (NSF, 2020).
Humanity’s needs for sustainable medicines supply – why we need it?
Humanity needs a dramatic change in the way we make and deliver medicines to patients. There are many “pains” that call for a dramatic shift in the way patients have access to drugs. Issues like drug quality, medicines affordability, medicine availability, the precision of drug dose prescription and the environmental impact of drug manufacturing and supply channels are preeminent “patient’s pains” and reasons why humanity needs such change.
The making of medicines had not changed much in almost 70 years. Manufacturing technologies developed in the 1950s are used in today’s pharmaceutical companies (Chaterhee, 2012). Figure 1 shows a comparison of a 1960’s rotary tablet press with a current-day tablet press. Other than a beautiful stainless-steel enclosure, the internal mechanism and design of both tablet presses follow the same principles. Technology changes have been historically slow in this regulated industry, but there is hope that is changing (Gottlieb & Woodcock, 2019, Hausner &Moore, 2018, National Science Foundation, 2006, and Pharmaceutical Technology Editors, 2016). The pharmaceutical industry is currently pursuing modernization of medicines manufacturing with the support of government regulators to change the way drugs are produced at the industrial setting, and with the hope to impact drug manufacturing quality and availability positively by the avoidance of drug shortages (Gottlieb & Woodcock, 2019, and US GAO Report, 2016).

Figure 1. Comparison between an old, 1960’s tablet press machine and a recent design for the same equipment. A. A 1960’s tablet press used for research and development. Adapted from “Instrumented rotary tablet machines I. Design construction and performance as pharmaceutical research and development tools,” by Knoechel, E.L., Sperry, C.C., Ross, H.E. and Lintner, C.J. (1967). B. A typical press used in commercial product manufacturing. Adapted from “Fette America: 3200i Double Rotary Tablet Press” by Pharma Manufacturing. Retrieved from https://www.pharmamanufacturing.com/vendors/products/2010/012/
The cost of medicines in the United States has been a political balloon with practically no action at the federal government level and little advances at the state level to bring medicines affordability (Dayen, 2018, Findlay, 2019 Sept. 9th). Non-government-organizations are identifying a significant suspect in drug prices hikes as Berkeley Research Institute and pharmaceutical companies (Stampler, 2019 Feb 8th, and Vandervelde & Blalock, 2017). The Berkeley Research Report on the impact of expenditures incurred as part of the supply chain shows that 61 % of the money paid by medicines goes to others than the brand’s manufacturers (Vandervelde & Blalock, 2017). Johnson & Johnson’s CEO Alex Gorsky, on an interview with Forbes, declared that they look for drug prices transparency by publishing their net price to bring the perspective of how drug prices at the consumer level structures (Sampler, 2019 Feb 8th). With a clear culprit, the markup price of the supply chain actors, the pharmacy benefit manager (PBM), wholesalers, and distributors, no discussion on reducing the handshakes in the supply chain medicines. Another sustainability imperative of medicinal need is the issues related to supply chain vulnerabilities that arise from disruptive events associated to natural disasters, global conflicts, and pandemic events like the recent CoViD-19, which affected the supply of medicines (Jarvis, 2018, Langhauser & Parrish, 2018, and UNOC Report, 2020). The upstream and downstream supply chains are affected by disruptive events like these depriving regions of the needed medicines to treat their population.
The economies of scale drive the manufacturing decision making of generic manufacturing, forcing them to prioritize the manufacturing of high market share products over low market share, small products that serve orphan medical needs (Luzzatto, Hyry, Schieppatti, Costa, Simoens, Schaefer, Roos, Merlini, Kaariainen, Garattini, Hollak, & Remuzzi, 2018, Porath, 2018, and Reiffen & Ward, 2005). Products that generics do not want to, or cannot make, provides a compelling reason for changing the way we manufacture medicines (Archer, 2015). Three specific medicinal needs to command the convenience of manufacturing capacity in an efficient small scale and flexible medicines manufacturing system. The medical needs are low-prevalent conditions, medicines with low priority for generics capacity, broad titration medicines or precision medicines, and pediatric dosing.
- Small prevalent and generics’ neglected medicines: low-prevalent conditions, those that are suffered by a small fraction of population and are served by what is designated by the FDA as orphan drugs, rapidly become highly priced and scarce medications (Luzzatto, Hyry, Schieppatti, Costa, Simoens, Schaefer, Roos, Merlini, Kaariainen, Garattini, Hollak, & Remuzzi, 2018). The price hiking of medicines is a significant part of the generic companies’ prioritization for their capacity use, resulting in low market competitive pressure to orphan drug brand makers and their ability to sustain high prices.
- Broad titration and precision medicines: Many new and generic products are better administered when multiple doses are available and prescribed according to the patient’s needs (Schuck, Pacanowski, Kim, Madabushi & Zineh, 2019). Current manufacturing procedures used by generic manufacturers or branded products were not designed to deliver variable doses at the patient’s needs. Products that require titration or genetic markers-based products made at fixed dosages in the hope one of the dosages produced will fit the specific patient’s needs.
- Pediatric dosing: Products approved for pediatric use requires special dosing instructions that are difficult for the patient’s custodian to accurately medicate children on solid dosage forms (Institute of Medicine, 2008). Instead of breaking a tablet or dissolving them in water for dosing, a preferred type of administration would be to precisely dose capsule or tablet content to the pediatric patient’s weight.
Last but not of least importance, the most common sustainability issue, environmental impact, is another pain of pharmaceutical manufacturing today. There are three main pains in the pharmaceutical companies related to environmental impact, expired product disposition, handling of hazardous materials from operations, and solid waste management. The most important and impactful is the handling and disposal of the expired drug product (Alnahas, Yeboah, Fliedel, Abdin, & Alhareth, 2020, and Harding, 2013). The traditional method of manufacture of pharmaceutical products where the batch size is for peak demand promoting over-production. Expired production returned to wholesalers, and the products that consumers do not use, represent a significant threat to the environment. In most cases, these materials’ handling is inadequate, usually flushed through the toilets or disposed of conventional waste management facilities, resulting in a source of pollution.
Figure 2 provides a summary of the five reasons humanity needs a sustainable
All these pains may have a common relief, the design of a technology platform that enables the manufacturing of drug products, particularly solid dosage forms, in a regionally distributed system that is flexible, modular, fully automated, and portable. The innovation design described in the next sections will provide the basis for the creation of this technology platform to fulfill the needs of hospitals, pharmacies, and patients that uses generic medicines. The strategy for this innovation includes intra-organizational, extra-organizational, and customer engagement elements.

->
Figure 2. Summary of the five reasons why humanity needs to have a sustainable medicine supply.
All these pains may have a common relief, the design of a technology platform that enables the manufacturing of drug products, particularly solid dosage forms, in a regionally distributed system that is flexible, modular, fully automated, and portable. The innovation design described in the next sections will provide the basis for the creation of this technology platform to fulfill the needs of hospitals, pharmacies, and patients that uses generic medicines. The strategy for this innovation includes intra-organizational, extra-organizational, and customer engagement elements.
How are we going to reach medicines supply sustainability? The innovation process design.
Reaching these pain relief requires a focused team that considers intra-organizational, extra-organizational, and customer participation in the design and creation of the technology platform needed. The following sections provide further details of the strategy proposed to reach this innovation.
Creating an innovation project team with a strong knowledge network. As Cummings and Pletcher’s (2011) revealed in their studies, teams that use a network of expert resources in their projects have batter probability of excelling on their objectives, providing the best value of the project achievements. This innovation project team will work under a multi-functional team design in an open innovation strategy where entrepreneurs and academic resources will mingle in the creation of this technology platform. University professors and their graduate students will collaborate with industry professionals and equipment suppliers to develop this robotic manufacturing line. The industry SME’s will be designated as team mentors and will come from Puerto Rico’s industry ecosystem. These mentors are senior experts on each discipline and experience in the recent technological advances in pharmaceutical manufacturing of Continuous Manufacturing (CM) and Process Analytical Technology (PAT). The core team will have four functional groups:
- Platform Design Team: This team has the objective of designing the manufacturing platform’s mechanical systems, controls, robotic capabilities, and process design in two phases. The first phase will be a distributed continuous manufacturing line that will produce relatively higr volume products on a regional basis. The phase 1 machine will serve the generic medicines needs of a small population, 1 to 3 MM people of the most prevalent conditions in a direct distributed supply chain. This team will also design and develop in a second phase the technology platform for the manufacturing of small prevailing conditions, precision medicines, and broad titration/pediatric dosing on-demand at the point of use. The team composition will be of subject matter experts (SMEs) designated as co-principal investigators (co-PI) in the disciplines of mechanical engineering, chemical engineering, and computer engineering. An industry mentor with analog expertise will support each of the engineering professors/students’ members
- Process Analytical and In-Process Controls Design Team: This team aims to design the non-destructive chemometric analytical tools of the future manufacturing platform to create analytical systems that permit analysis without the need for sampling or testing outside the robotic unit. All product testing will occur at the manufacturing line on-site, using chemometric/parametric models for product release for patient use. This team composition will be of SMEs in chemistry, and it includes a University-based research Ph.D. in chemometrics co-PI with graduate students and an industry mentor with experience in chemometrics.
- Pharmaceutical Formulation, Process Development, Technology Transfer, and Regulatory team: This team will have the objective of designing the formulas for the selected products of the two project phases. Starting with the first six products, the formulation team will create standard formulas that should fit the formulation requirements for the line operational space. The formulation model will consider properties as flow/density and shear properties, drug load level (high and low), in a formulation strategy that minimizes the number of materials needed and provide the extended material life required for stockpiling of raw-materials for a prolonged time. This team will also design the formulas and formulation procedures for the robotic line of phase 2, will develop the technology transfer plan and the regulatory submission strategy. The team will have a professor of pharmaceutical sciences co-PI, a materials sciences co-PI, a registered pharmacist, a regulatory expert (ex FDA senior member), and an industry SME mentor.
- Supply chain transformation and sustainability team. This team will be responsible for designing the new regional and robotic point-of-use manufacturing line and its supply chain and logistics requirements. The team will collaborate with the other teams in the design for the sustainability of the technology platform, the eco-friendly design of systems components, materials handling, and the efficient use of resources to eliminate overproduction risk and waste generation. It will also design the recycling plan for the project, including means to return and re-use containers used to dispense materials during manufacturing. The team composition includes an Industrial Engineering Co-PI with graduate students’ expertise in logistics, planning, and eco-manufacturing. Two industrial SMEs will provide knowledge sharing on pharmaceutical industry environmental sciences and logistics.
Each of the sub-teams will be part of the core team, which is an overarching team. An expert in project management, previously working on a similar industry project, will mentor a graduate student that will serve as the core team lead. The industry mentor has experience leading similar innovation projects. The team will meet regularly to coordinate and finetune collaboration between sub-teams, create and maintain a task list, and ensure flawless execution of the project. The team leader will also serve as the liaison between the core team members and the project sponsors.
The team sponsorship will have three members, a senior professor or principal investigator, two customer representatives, members of a Hospital system, and a Pharmacy chain at Puerto Rico. The sponsor team will be linked to the project team with the customers through frequent interaction with the team leader and the core team. The hospital and pharmacy customer’s representatives will provide feedback to the team on the customer’s needs during the development stages. They will provide additional resources to evaluate and provide feedback on the pre-prototypes and prototypes developed during the project. The project timeline spans over five years, and the financial support for the project execution was requested through a National Science Foundation grant (NSF 20-552 Future Manufacturing Research Grant, 2020).
Figure 3 provides a diagram that depicts the project team composition and the interactions between them.
In summary, the project team will execute this innovation plan in two phases. Phase 1 will provide the benefits of regionalized manufacture of generics, allowing for adequate stockpiling of materials with an extended expiration and adequately addressing the needs for medicines availability in a supply chain disruption event. The design of this phase 1 line is amenable for installation in remote locations to serve deprived populations or any place where medicines need to be, even at Mars. The phase 2 robotic micro-line will provide additional benefits associated with the duly required precision or personalized medicines. It will open a new way to deliver old generic doses with broad titration needs and future branded orphan drug products. Figure 4 shows a roadmap of this innovation project.

Figure 3. Innovation project team composition and sponsorship.

Figure 4. Overall project road map showing the two phases of the project toward the robotic micro-manufacturing line
The innovation project: A project design based on a cluster of innovation and open innovation. Part of the success of this significant innovation project will require an orchestration of a significant number of industry providers, academic experts, hospital & pharmacy providers, customers, entrepreneurs, and the participation of industry experts and regulators. A cluster of innovation, and possibly a model based on open innovation can provide the necessary resources that can take this project into a successful completion (Tuulenmäki & Välikangas, 2011, and Engel & del-Palacio, 2011). The New Jersey area is a hub or cluster of innovation for the biopharmaceutical sector (Bio NJ, 2018). It is composed of several major biopharmaceutical companies, equipment, materials, and services providers, as well as academic institutions with active collaboration with the bio sector. Among the institutions that have traditionally compose the academic collaborators are Rutgers University, NJIT, and Princeton University. One example of an open collaboration between equipment suppliers, academic partners, and industry members for the development of Continuous Manufacturing and Real-Time Release technologies for the manufacture of solids dosage forms. The National Science Foundation-sponsored, an Engineering Research Consortia of Industry and Academia where Rutgers University, Purdue University, NJIT, and the University of Puerto Rico Mayaguez participated in the development of these technologies for sponsors like Johnson & Johnson. These learnings help Janssen Supply Chain develop a solution to the elusive JIT full application in the pharmaceutical processing environment, with the participation and sponsorship of the FDA (NSF, 2006).
This innovation process design will leverage the relationship and knowledge base gain during the NSF sponsored ERC-SOPS consortia and expanded on it in a similar open collaboration approach. This project plan, as described in the previous section, will relly on the collaboration with academia, industry members and equipment, materials, and systems suppliers at the NJ COI and Puerto Rico. Table 1 shows the proposed cluster companies, academic centers, industry members, entrepreneurs’ companies and customers called for collaboration

Involving the customer in the innovation design process. Customer involvement in creating innovation is of extreme importance (Sandmeier, Morrison & Gassmann, 2010). Sandmeier et al. (2010) mention in their article the closing statement that, translating customer involvement in the regulated industry must be done carefully, it is though something possible in this case. Since our objective is to create a system that improves medicine availability, it is entirely reasonable to use the customer to co-create this product. This is why we decided to include the customer in the sponsor’s team. The sponsor team includes the principal investigator, the customers including a hospital and pharmacy delegates, and the project team lead. The customers will be exposed to the products from the phase 1 regional manufacturing line and later in phase 2 those that will secure our technology platform to compound their generic products. Our plan provides for an iterative process of design, experimentation, prototyping, customer feedback, analysis, and when needed, re-design, and repeat the process. This approach permits the continued and reiterative examination of our product hardware and software components by our customers to ensure that what they need is what they get. Figure 5 shows a diagram depicting the product development process and the customer feedback process.

Figure 5. Diagram of the customer involvement iterative process.
Conclusion
There is an imperative need for the transformation of medicines supply, allowing for improved sustainability of drug manufacturing in many angles. This innovation process design provides a guideline on how to ensure a successful innovation in the production of medicines that considers intra-organizational aspects, clusters of innovation with open innovation, and customer involvement in the design of the innovative solution. A successful grant approval by NSF depends not only on the scientific merit of the proposal; it also needs to prove its viability for a future commercial deployment. The innovation design provided in this document permits a project’s focus on proven methodologies that showed to be successful for many firms on the development and implementation of new products.
References
Alnahas F, Yeboah P, Fliedel L, Abdin, A.Y., and Alhareth, K. (2020). Expired Medication: Societal, Regulatory and Ethical Aspects of a Wasted Opportunity. Int J Env Res Public Health 17 (3): 787 Retrieved from https://www.mdpi.com/1660-4601/17/3/787
Archer, R. (2015). Precision medicine; imprecise manufacturing and supply. The Medicine Maker. Retrieved from https://themedicinemaker.com/manufacture/precision-medicine-imprecise-manufacturing-and-supply
Bio New Jersey (2018). The New Jersey biopharmaceutical industry: A prescription to growth. Bio NJ. Retrieved from https://bionj.org/the-new-jersey-biopharma-industry-a-prescription-for-growth
Chatterjee, S. (2012). FDA perspective on continuous manufacturing. IFPAC Annual Meeting, Baltimore, MD. Retrieved from https://www.fda.gov/media/85366/download
Cooper, R. G., Edgett, S. J., & Kleinschmidt, E. J. (2002). Optimizing the stage-gate process: What best-practice companies do-I. Research Technology Management, 45(5), 21-27. Retrieved from http://library.capella.edu/login?qurl=https%3A%2F%2Fsearch.proquest. com%2Fdocview%2F213806181%3Facc
Cummings, J., and Pletcher, C. (2011). Why project networks beat project teams. MIT Sloan Management Review, 52(3), 75-80. Retrieved from http://library.capella.edu/login?qur l=https%3A%2F%2Fsearch.proquest.com%2Fdocview%2F861418971%3Faccounti
Dayen, D. (2018). Elizabeth Warren plan would allow the government to manufacture its own generic drugs. The Intercept. Retrieved from https://theintercept.com/2018/12/18/elizabeth-warren-generic-drugs-bill/
Engel, J.S., and del-Palacio, I. (2011). Global clusters of innovation: The case of Israel and Silicone Valley. California Management Review, 53 (2), 27-49. https://doi-org.library.capella.edu/10.1525/cmr.2011. 53.2.27
Findlay, S. (2019). States pass record number of laws to reel in drug prices. Kaiser Health News. Retrieved from https://khn.org/news/states-pass-record-number-of-laws-to-reel-in-drug-prices/
Gottlieb, S. and Woodcock, J. (2019). FDA is advancing new efforts to address drug shortages. FDA web page blog, retrieved from https://www.fda.gov/NewsEvents/Newsroom/ FDAVoices/ucm626108.htm
Harding, C. (2013). The environmental impact of the pharmaceutical industry. US Green Technology. Retrieved from https://usgreentechnology.com/the-environmental-impact-of-the-pharmaceutical-industry/
Hausner, D.B. and Moore, C.M.V (2018). Continuous manufacturing current status. Pharmaceutical Engineering. Retrieved from https://ispe.org/pharmaceutical-engineering/may-june-2018/continuous-manufacturing-current-status#
Institute of Medicine (2008) Forum on Drug Discovery, Development, and Translation. Addressing the Barriers to Paediatric Drug Development: Workshop Summary. Washington (DC): National Academies Press (US). Retrieved from https://www.ncbi.nlm.nih.gov/books/NBK3995/
Jarvis L. (2018). Hurricane Maria’s lessons for the drug industry. Chemical & Engineering News. American Chemical Society. Retrieved from https://cen.acs.org/pharmaceuticals/biologics/Hurricane-Marias-lessons-drug-industry/96/i37.
Knoechel, E.L., Sperry, C.C., Ross, H.E and Lintner, C.J. (1967). Instrumented rotary tablet machines I. Design construction and performance as pharmaceutical research and development tools. Journal of Pharmaceutical Sciences 56 (1) 109-115. DOI: https://doi.org/10.1002/jps.2600560122
Langhauser K and Parrish M. (2018) Puerto Rico pharma: battered but unbroken. Pharmaceutical Manufacturing. Retrieved from https://www.pharmamanufacturing.com/articles/2018/puerto-rico-pharma-battered-but-unbroken/
Luzzatto, L., Hyry, H., Schieppatti, A., Costa, E., Simoens, S., Schaefer, F., Roos, J.C.P, Merlini, G., Kaariainen, H., Garattini, S., Hollak, C.E., and Remuzzi, G. (2018). Outrageous prices of orphan drugs: a call for collaboration. The Lancet 392 (10149) 791- 794. Retrieved from https://www.thelancet.com/journals/lancet/article/PIIS0140-6736(18)31069-9/fulltext
National Science Foundation (2006). NSF awards $75.3 Million for five new engineering research centers. Retrieved from, https://www.nsf.gov/news/news_summ.jsp?cntn_id= 107939
National Science Foundation (2020). Call for proposal for Future Manufacturing Research Grant, NSF-20-522. National Science Foundation. Retrieved from https://www.nsf.gov/pubs /2020/nsf20552/nsf20552.htm
Pharmaceutical Technology Editors (2016). FDA approved tablet production on Janssen continuous manufacturing line. PharmTech.com. Retrieved from http://www.pharmtech .com/fda-approves-tablet-production-janssen-continuous-manufacturing-line
Porah, D. (2018). Size and dynamics of order-of-entry effects in pharmaceutical markets. International Journal of Market Research 60 (1) 50-66. DOI: 10.1177/1470785317744669 journals.sagepub.com/home/mre
Sandmeier, P., Morrison, P.D., and Gassmann, O. (2010). Integrating Customers in Product Innovation: Lessons from Industrial Development Contractors and In-House Contractors in Rapidly Changing Customer Markets. Creativity & Innovation Management, volume 19, issue 2, pages 89–106. Retrieved from http://web.b.ebscohost.com.library.capella.edu/ehost/pdfviewer/pdfviewer?vid=1&sid=2dfa07ff-9c5c-4a9f-9b39-75411aa73e67%40sessionmgr103
Stampler, L. (2019, Feb.8th). Johnson & Johnson will be the first drug company to put prescription medication prices in TV ads. Forbes. Retrieved from https://fortune.com/2019/02/08/johnson-and-johnson-drug-price-tv-ads/
Tuulenmäki, A., and Välikangas, L. (2011). The art of rapid, hands-on execution innovation. Strategy & Leadership, 39(2), 28-35. doi:http://dx.doi.org.library. capella.edu/10.1108/10878571111114446
Vandervelde, A. and Blalock, E. (2017). The pharmaceutical industry supply chain: gross drug expenditures realized by stakeholders. Berkeley Research Group Report. Retrieved from https://www.thinkbrg.com/newsroom-publications-pharma-supply-chain.html#
The article from Battersby (2013): Funding your business expansion, provides a series of recommendations around financing strategies for small business. It explains the different options of finance that a small business can reach for a business expansion.
Main Points: The main point brought by Battersby (2013) on his article is that for a growing small business many financial risk should not be a deterrent for business owners expansion ideas, as careful evaluation of existing financial sources can help select the right borrowing strategy to achieve their goals on reaching a competitive advantage.
Evidence: The evidence provided in Battersby (2013) is based on documented financial programs that are available for acquiring debt. He also explains the financial strategies based own knowledge or experiences as citations are not provided in the article.
Analysis: Battersby (2013), started his article by clearly indicating the problem that many small business owners have while evaluating getting into a business expansion opportunity. The risk of cashflow issues is one of the major deterrent of business owners on considering an expansion, mainly as a fear of committing income to borrowing paybacks could affect their cashflow. Battersby brings a series of options to consider when in need for borrowing as alternative options that a small business owner can consider rising expansion funds. The following were the options given:
- Do-it-yourself: This is the use of equity build by a company to finance business expansions. Instead of distributing the stockholder’s equity in the form of dividends, agreements can be reached with the stockholders to use this money to make the expansions that will eventually pay off as business profit growth.
- Equity financing: This is selling a portion of the company’s stocks to investors in exchange of funds for expansion. Constrains includes first convincing the investors of an eventual equity premium is viable and the fact of losing part of the control of the company’s decision making to an outsider.
- ESOP option: Employee Stock Ownership Plans (ESOP) is a way of finance where the employees are offer participation on the company equity through a financial plan that pay off for the investment. The company issue a package of shares of stocks and sell it to the ESOP. The ESOP usually borrow money to buy the stock and the company uses the money to invest on the store expansion. The company re-pay the agreed amounts to the plan which are tax deductible.
- Bank borrowing: Usually consider for the short term borrowing needs, working capital to improve cash flow and long-term capital expenses financing.
- Government loans: Usually from the US small business administration (SBA), loans are available for small business growth opportunity, that requires less stringent requirements on collaterals as bank borrowing, and long-term payback periods.
- 504 Loan Program: Is a top end lending program from the SBA that allows higher amount borrowing for long term investments, usually on real estate and machinery. These loans are made with intermediaries call certified development companies (CDC’s) which are not for profit intermediaries that work with the SBA, banks and businesses on their financial needs.
- Local funds: funds available through local or regional economic development agencies. The charter of these agencies is to facilitate economic development at the communities they serve, in that objective, financial assistance of small business should be part of their offerings.
Linkage: The article has a nice flow and logic progression. It provided clear information with words of advice intercalated on the different financial options discussed. The article logic is set for a light, informative reading that could spark the interest of a reader on finding additional information on financial strategies.
Strategy in the age of superabundant capital
This article discusses organization’s strategies for growth in a financial environment where capital may not be a constrain to consider when opportunities come. Mankins, Harris and Harding (2017) brings a historical recollection of the financial landscape changes that occurred in the last three (3) decades ending at the current times where cost of capital is at a low point and provides a discussion on how organizations can take advantage of this favorable financial landscape.
Main Points: The main point of this article is that capital availability at low cost provides an excellent opportunity for financing growth projects based on two main strategies, lowering hurdle rates and managing well the human capital.
Evidence: Mankins, et al. (2017) based their article in data from their research on financial market indicators. The evidence provided included the following indicators information:
- Growing financial markets in emerging economies: capital super abundance is supported by the growth of emerging economies like China and India
- Expanded number of high end savings: demographics advantage of population at ages of 45 to 59 which contributes with their savings on the available capital funds.
- Cost of equity: In the last three (3) decades a consistent decrease in cost of capital had reach the lowest point in 2015 at a rate of 5.3 %. (Mankins, et al., 2017, figure titled “how the cost of capital has evolved”, page 70)
- Return on growth investment: with the lower cost of capital, investment on growing opportunities are prone to deliver higher returns. (Mankins, et al. 2017, figure titled “choosing a strategy: profitability or growth”, page 70). Mankins, et al. 2017, provided a couple of examples of companies making multiple projects on growth that show excellent returns of investments, (e.g. WPP a marketing company and 3M a materials and consumers products company).
Analysis: Upon discussion of the reasons why capital is superabundance and should keep like in the near term, Mankins, et al. (2017) started a discussion of the strategies that organizations must follow to take the advantage of the lower capital cost for business growth. Their recommendations were the following:
- Reduce hurdle rates: company’s standards for the evaluation of project’s business cases should consider the lower cost of capital and minimize the percent rate used in the determination of financial indicators like Net Present Value. If companies keep higher rates for the assessment projects they would be overly conservative in their determinations of cashflow benefits of a project and may reject projects that otherwise are viable.
- Focus on growth: at lower cost the return of investment of growth projects should be higher than that of profitability projects. The examples provided by the authors on WPP and 3M show the profit increase tendency of sponsoring multiple growth projects.
- Invest in experiments: with super abundant capital managers can increase their risk taking by experimenting with new ideas at a higher rate. Example given was Alphabet which embarks in multiple ventures some of which are successful and other not. The key is to identify exit rules to minimize loses on non-successful projects.
- Human capital: if capital is not an issue what then becomes an issue is the ability of an organization resources of inventing new growth opportunities. Managing human capital in this case become critical for growth opportunities. Talent people is the fundamental source for organizations competitive advantage, promoting significant higher productivity in growing settings.
Since the date at which this article was published on March 2017, uncertainty on the financial market had started to build up by the Federal Reserve Bank prime rate increases. Rates at March 2017 where 4 % versus current rate which is 5.5 %, with expectations of a continued increase by the federal reserve (Fed Prime Rate, 2019). The question is, how long will low cost capital will last and what impact the rates increase will have on companies’ growth?
Linking: Mankins, et al. (2017) article had a nice reading flow with relevant knowledge progression and logic approach to the arguments they brought. The approach they follow on the analysis of the financial landscape is very well substantiated by data. Evidence provided was substantial and in line with the progressive evaluation that the authors brought on the topic.
Finally, proof that managing for the long term pays off.
The last article on this discussion is from Harvard Business Review, Barton, Manyka & Williamson, 2017. This article provides an analysis of companies’ financial metrics that according to the authors is capable of distinguishing companies that have sustainable growth based on long term investment planning to those that prioritize the short term.
Main Point. The main point of this article is the description of a quantitative method that can measure the long-term strategies adherence on profitability and growth.
Evidence. The corporate horizon index, is a multivariate index based on financial data from a substantial number of companies created by a group form by MGI, McKinsey group, Harvard Business School Strategy and Corporate Finance and FCLT Global. The proprietary index was created on a survey study of 60 to 65 % of US Public market capitalization companies over the study period (2001 to 2015). The report referenced by Barton, et al. (2017) provided additional information from the variables used, which included investments, growth, earnings equity and earnings management (McKinsey global, 2017).
Analysis. The analysis of the variables described by Barton et al. (2017) provided a distribution of the companies analyzed in two group. One group that operates on the long term (164 companies, 27 % of the sample), and the second group of 451 companies (73 %), operates in the short term. The analysis of revenues on the two groups revealed differences that were significant and demonstrated the benefit of operating in the long-term strategy. Companies in the long term showed:
- 47 % more revenue when compared to the short-term companies
- 36 % higher earnings when compared to the short-term companies
- Less volatility on revenue growth, standard deviation of 5.6 vs 7.6 on the other companies
- Higher investment rate on R&D
- Companies on the long-term tend to produce more jobs, and contribute greater to the Gross Domestic Product (GDP)
Linking. Article flow of information was good, evidence provided is strong and well-studied. A significant number of companies was included in the index evaluation. The arguments set on the data observations are logic and substantiated.
Case Study: GlaxoSmithKline financial analysis
GlaxoSmithKline, PLC (GSK), is a Fortune Global 500 company, position 290 in 2018 pol (Fortune Global, 2019). The company is a global company with headquarters in England, UK. GSK specializes in three (3) health care core businesses in vaccines, pharmaceuticals, and consumer health care products (MarketLine Company Profile, 2018).
The company financial stance is clearly one of a growing company. Analysis of the company revenues, operating margin, and net profits year by year confirms an adequate growth stance (GSK Annual and Financial Report, 2018). Table 1 shows a composite of the financial statements for GSK for a period of 5 years including 2018 (Annual reports, 2018, 2015, 2012, Press Release, 2019). The following highlights can be derived from the financial data presented in GSK annual reports.
- On a 10 years basis, GSK showed an improvement of revenues grow in the last 5 years, showing consistent growth within the range of 2.1 to 16.58 % increase year over year
- On a 10 years basis, GSK showed a negative growth trend reversed in the gross profit growth, where year over year since 2015 increases in gross profit were observed between 3.71 % to 23.41 % within the last 5 years.
- Although the R&D spending can’t be directly associated to growth with the information provided, it can be argued that the consistent spending in R&D with as substantial increase in prior years (2009 to 2010 with an increase of 8.55 %), may be correlated to the sustained growth in revenues and gross profit observed in the last 5 years
The information collected from the annual reports income statements it can be observed that GSK showed an improved revenues and gross profit figures that maybe related to prior years R&D investments. A plausible explanation for the observed latest growing trend in GSK revenues and gross profit can be that GSK pipeline of products is robust and they have a business model with a strong stance on differentiation, innovation and collaborations for growth (MarketLine SWOT analysis, 2018).
Conclusion
The information provided in the articles included in this discussion provides a good understanding of the financial landscape of the latest years. Considerations of using the lower cost of capital opportunity that represents the current financial landscape were discussed in each of the three articles. Most of the recommendations given by the articles authors call into taking advantage of such opportunities by investing in business growth opportunities, both in the short as well as in the long-term plans. It was nicely show that investing in the with a long-term strategic vision in an environment where cost of capital is low, should serves the purpose of expanding profitability of the company. The case of GSK provided indications that investing in R&D activities over a span of 10 years resulted in a positive growth trend over the last 5 years, which tend to indicate a correlation between this type of investment and company revenue and profit growth.

References
Battersby, M. E. (2013). Funding your business expansion. Convenience Store Decisions, 24(10), 130–134.
Barton, D., Manyika, J., & Williamson, S. K. (2017) Finally, proof that managing for the long term pays off. Harvard Business Review Digital Articles, 2–8.
Fed Prime Rate (2019). Federal prime rate history. FedPrimeRate.com. Retrieved from: http://www.fedprimerate.com/wall_street_journal_prime_rate_history.htm#current
GSK Annual Report (2018). GlaxoSmithKline PLC annual report for 2017. Retrieved from, https://www.gsk.com/media/4751/annual-report.pdf
GSK Annual Report (2015). GlaxoSmithKline PLC annual report for 2014. Retrieved from, https://www.gsk.com/media/2711/annual-report-2014.pdf
GSK Annual Report (2012). GlaxoSmitKline PLC, annual report for 2011. Retrieved from, https://www.gsk.com/media/2696/annual-report-2011.pdf
GSK Full Year Report (2018). GlaxoSmithKline PLC full year and fourth quarter report. Retrieved from, https://www.gsk.com/media/5287/fy-2018-results-announcement.pdf
Mankins, M., Harris, K., & Harding, D. (2017) Strategy in the age of superabundant capital. Harvard Business Review, 95(2), 66–75.
McKinsey Global (2017). When companies with a long-term view outperform their peers. McKinsey & Company. Retrieved from: https://www.mckinsey.com/featured-insights/long-term-capitalism/where-companies-with-a-long-term-view-outperform-their-peers
The interrelation of organization’s structural components like ethics, human resources management (HRM) and information systems (IS) can influence organization financial performance in positive or negative ways depending on the organization’s performance on these practices. The purpose of this article is to evaluate the contribution of organization’s corporate social responsibility (CSR) as an ethics practice, network working as a HRM practice, and knowledge management as an IS practice, to the organization’s financial performance. The article is based on an expansion of readings provided as part of Units 4, 5 and 6 of Capella’s DBA course DB8002, Vallaster, Lindgreen & Maon (2012) on the CSR practice, Swart & Kinnie (2014) on the network working practice, and Khedhaouria & Jamal (2015) on knowledge management practice. The articles selected to expand on these topics are, Kanzler, Niedergassel & Leker (2011) on the topic of knowledge management, Popa & Salanţă (2014) on the topic of CSR, and Melese, Lin, Chang & Cohen (2009) on the topic of network working.
Theory – Article Deconstruction
The formulation of successful strategies on business ethics, HRM and IS practices in an organization represents an opportunity of success or failure depending on the approaches followed by the organization. The successful side of CSR implementation, the ability of a company to effectively use external talent resources on innovation programs as well as the adequate use of own or externally sourced information creating innovation will be part of the intended expanded discussion of this article. Three articles in these business practices, will be deconstructed, analyzed and critically examined using the M.E.A.L methodology. The scholar articles on these three business practices; CSR (Popa and Salanţă, 2014), network working (Melese, et al. 2009) and knowledge management (Kansler, et al. 2011) are further discussed.
Corporate social irresponsibility (CSI) another way of looking at unsuccessful implementation of company’s social responsibility.
Vallaster, et al. (2015), brought few examples on how CSR can be badly damaged by corporate actions, one of the examples that clearly show a disconnect on CSR strategies was Toyota example of the Prius eco-friendly campaign contrasted to the company’s lobbying against tougher controls on car emissions. Bringing this example, Vallaster, et.al. (2015) brought a concept of social responsibility failure that can degenerate into a corporate social irresponsibility (CSI) practice. Of course, taking this act form Toyota into a CSI level might be an exaggeration, but it is a real conceptual framework brought by Popa & Salanţă, (2014). This is the first concept expansion that is bring to this article; is there a substantial damage risk around a company’s mistake on public social image that could degenerate into a CSI?
Main points. Corporate Social Irresponsibility can be defined as the wrong side of adequate corporate ethic behaviors where wrongful and damaging business decisions managers take can damage corporations public image and their profits. Popa & Salanţă, (2014) intention was to bring the conceptualization of the topic in the hope their suggestions can help academics and company’s managers finding ways to reduce CSI and enhance CSR.
Evidence. Popa & Salanţă (2014) discussed several historical record evidences of CSI in the form of cases or anecdotal evidence from numerous scholar’s work. On definitions, they brought examples of prior authors concluding that CSI reflects company’s practices of irresponsibility such as corruption, bribery, environmental degradation, social injustice (Lange and Washburn, 2012, and Sanchez-Runde, Nardon and Steers, 2013). Popa & Salanţă, (2014) brought a plethora of oil business companies as examples of what in fact, started as CSR initiatives that clearly unmask an exchange of a good against wrong doing on their business practices. The examples brought by Popa & Salanţă (2014) were from Atlantic Richfield Company (ARCO), Lundin Petroleum, and British Petroleum, were wisely brought to illustrate the connection between CSR and CSI, where most of the time companies like these strategically bring CSR programs as a form of paying back against their business irresponsibility’s.
Analysis. The point brought by Popa & Salanţă (2014) on the practices of some companies on using CSR as a form of vindication against a wrong or misjudgment action, or on the other hand, how these wrong or misjudgment actions can lead to declare a company a CSI practitioner, were nicely substantiated by Popa & Salanţă’s article. One of the three examples brought by Popa & Salanţă (2014) was dramatic and is currently a big story at Europe particularly Sweden (ECOS report, 2010). ECOS report brings accusations to Lundin Petroleum of misconduct and crimes against humanity as a result of their oil extraction operations in Sudan, Africa. This report triggers a criminal investigation by the Swedish Prosecution Authority which is near to conclusion. In a press release issued by Lundin Petroleum, they publicly notified about the Swedish Prosecution Authority declaration on the liabilities that the company is at risk as part of their investigation into past operations in Sudan from 1997 to 2003 (Lundin Press Release, 2018). Lundin Petroleum denies the allegations and produced a report on their grounds of their business activities and Sudan with great emphasis on their CSR programs at this country (Lundin Report, 2016). Even though this story is still at its climax and there is no resolution yet upon Lundin’s responsibility on this issue, one thing is true, this is a perfect example of how some companies pay one bad with one good in a CSI vs CSR context.
Linking. Popa & Salanţă (2014) paper was nicely written, providing the historical perspective of both CSR and CSI, with multiple examples of anecdotal and prior research nature of the CSI concept. The example they brought on the petroleum cartels where finely targeted for their purpose, as digging a little bit on them can bring light to the importance of the CSI topic, and that the need of research on it is certainly relevant and actual.
Open innovation networks in biopharmaceutical industry, a form of network working that focus on innovation
Swart & Kinnie (2014) created a theoretical framework that explains the types of network working in two dimensions. The dimension of the modalities of network working expressed by their research activity, and the definition of a modeling framework for different levels of network working relationships. In this concept expansion, this article brings the involvement of Innovation as a main purpose of a network working approach around the academic and industry collaboration. Melese et al. (2009) article provides a good description of the importance of academic and industry collaboration in the form of open innovation networks. The M.E.A.L. analysis of this article should bring light to the question; are academic innovation networks a competitive advantage and growth factor in the biopharmaceutical industry?
Main points. Melese, et al. (2009) article main point was to provide a series of strategies intended to foster academic and industry collaborations that could bring transformative therapeutic procedures and products while overcoming the cost escalation of recent years.
Evidence. The evidence provided by Melese, et al. (2009) was based on case studies and anecdotal experiences and the research of others on the topic. Evidence is provided with data collected from industry and US FDA sources. They also provide information collected from interviews to industry and university members, nevertheless, specific information on the interview procedure was not provided by authors. With the information collected by Melese, et al. (2009) and others, Melese’s recommendations were targeted toward the optimization of the use of academic collaborations in the development of innovations for therapeutic solutions to heath issues.
Analysis. Melese, et al. (2009) started by establishing a series of models that industries are currently pursuing on collaborations with academia. Based on interviews with academic and industrial institutions, eight (8) distinct models were identified; one company-one investigator, one company-one university, one company supports a university consortium, one company support a university institute, industry consortium (pre-or noncompetitive), competition, venture capital investment and fee for services (Melese, et al. 2009, table 1, p. 503). Each of these models have their advantage and disadvantages, and it was clear from Melese, et al. (2009) that additional work is needed to optimize the models, particularly in open innovation.
Open innovation (Chesbrough, 2002), is a concept where the full knowledge or part of the knowledge gain in a collaboration is shared with other academic institutions, researchers or even with other industry in the objective of advancing the knowledge base and spark additional innovation. This is easier say than doing as constrains exist from either the academic institution or industries in the biopharmaceutical industry. From the industrial partners, pressure builds upon keeping information secret or safeguarded as part of their strategies on competitor’s blockage, through patents and trade secrecy of knowledge, whatever it is. From the academic side, limitations to open innovation also comes from use of academic institution’s facilities, as they might have government-based restrictions on the ownership of intellectual property generated on their facilities. In addition, there are cultural aspects that need to be overcome, specifically in terms of the cultures and values of academics versus the culture and values of industry on tactical aspects of project management, knowledge sharing, publications and projects governance aspects like budget, staffing and other issues.
A series of recommendations or solutions are posted by Melese, et al. (2009) that served on their objective to facilitate and optimize academic collaboration with industry as follows:
- Collaborative agreements: Current trend on the preparation of collaborative agreements between academia and industry include the establishment of common governance structures that facilitates the interaction between academic and industry members. These agreements include the basis for the bilateral exchange of information, creating project plans and management of resources through specific goals and objective milestones.
- Establishment of public and private funded agencies: Another approach to facilitate the implementation of academic/industry collaborations is through the creation of government funded consortia for the development of fundamental knowledge base that is needed to further create innovation in the biopharmaceutical industry. The example given is the case of Academic Medical Centers (AMC) funded by the US National Institute of Health (NIH), through their Clinical and Translational Science Awards (CTSA).
- Establishment of pre-competitive collaboration centers: The purpose of such centers is to create the knowledge in basic questions related to biopharmaceutical innovation in areas like; building defined patients cohorts particularly in rare diseases, biological specimen banks, molecular and pharmacogenomic analysis, obtain molecular biomarkers, develop better clinical trials, elucidate disease pathways and improve decision making on drug candidates.
- Creation of innovative research networks: Melese, et al. (2009) proposed the creation
of innovative research networks with three primary objectives:
- Create collaborations with a perceptible value proposition: A value proposition for such network includes, lower cost structures, lower price to patients, better understanding of the molecular fundamentals of diseases and patient’s response to treatment.
- Manage industry and academic collaborations as it would be an investment portfolio: effort placed on a program will have to be subject to milestones achievements that measure their ability for continuation or dismissal.
- Adopt a new attitude about sharing information: an open innovation network by definition, which is what is intended with these innovation research networks, requires knowledge to be shared to be effective. To be able to do this in a competitive environment, the authors proposed the classification of information as proprietary and nonproprietary at initium. This would enable companies share their information without fear of setting at risk their competitive advantage.
Linking. Melese, et al. (2009) paper was nicely written, with a good reading flow and deep understanding of the topic. The authors showed superb expertise on the subject knowledge of academic collaboration, providing in depth analysis and recommendations on this industry trend. The description of open innovation network opportunities and how to reach these collaborations optimized, revealed clear domain of the topic by the authors. Although there was not much empirical data presented, the analysis done via interview basis was excellent based on the conclusions reached on their findings.
Digging deeper on knowledge sharing on academic collaborations and its quantitative relationship to cultural aspects.
Transitioning nicely from the previous article analysis and continuing into the third topic on IS related knowledge management, the article subject of this concept expansion touches both the knowledge management aspects and the network working aspects related to academic collaboration. This article from Kanzler et al. (2011), was a nice addition to this article as it consolidates these two subjects of interest. The article added concepts not discussed by Khedhaouria & Jamal (2015), nor Lin (2015) articles in Unit 6. This article deconstruction will provide additional analysis of the impact of cultural differences between collaborating groups and how these differences impact innovation projects outcomes.
Main Topic. The objective of Kanzler, et al. (2011) on their article was to provide evidence of cultural diversity impact on knowledge sharing in academic/industry collaborations, and how elements of culture as independent variables (“subjective norm”, “image”, “anticipated extrinsic rewards”) impact the dependent variable of “intention to share knowledge”.
Evidence. The evidence provided by Kanzler, et al. (2011) was empirical and quantitative. They performed a study on an R&D institute at a Chinese academic institution in collaboration with German scientist on the area of nanotechnology research. The study was conducted using a survey provided to the Chinese and German PhD’s and professionals working on a nanotechnology research center at China. An 80 % of the survey submitted were answered for a total of 43 surveys that split into 17 from Chinese respondents and 26 from German respondents. The survey questions were adapted from several previous researches to establish the relationship of the three independent variables of subjective norm, image, and anticipated rewards to the dependent variable of intention to share knowledge. The study quantification procedure used the Likert scale of five (5) points. The model uses the structured equation model procedure (SEM) establishing the relationship between each independent variable to the dependent variable for each experimental group, being the Chinese and the German survey respondents making comparisons of the resulting statistics to the total sample analysis.
Analysis. The study analysis consisted on establishing the statistics for the hypothesis pairs of the previously mentioned variables using SEM methods. The hypothetical relationship of the variables was established by a careful examination of the behavioral literature of Chinese and German cultural constructs. Based on their literature analysis Kanzler, et al. (2011) established the following hypothesis for statistical confirmations:
- H1: Subjective norm should have a larger and positive influence on the predisposition to share knowledge in Chinese group when compared to the German group
- H2: Image should have a larger and positive influence on the predisposition to share knowledge in Chinese group when compared to the German group
- H3: Anticipated extrinsic rewards should show equal results on the predisposition to share knowledge between Chinese and German groups
The interpretation of Kanzler, et al. (2011) of the survey statistical analysis indicated that there were no statistical significant differences between the Chinese and the German groups in either of the three (3) hypothesis test (Kanzler, et al. 2011, Table 1, page 13). Interestingly, the SEM results are in contradiction to the original base information that the authors brought in their preamble to the study design, specifically on the first two hypothesis. Some noticeable points on the data provided by Kanzler, et al. (2011) are:
- In the case of the subjective norm variable, the R2 showed that the percent variability explained by this variable relationship to the predisposition to share knowledge indicate that this model explains 85.6 % of the relationship variability. This is an indicator that the result obtained, which showed that there is no statistical difference between the Chinese and German groups with respect to this variable influence on predisposition to share knowledge (p < 0.01) is strong and should be taken confidently.
- The other two study variables were weaker than the first one on the model ability to predict its relationship to the predisposition to share knowledge. The R2 value for the Image variable showed to be around 50 % capable of explaining the prediction variability, while the R2 of the anticipated reward showed only a 35 % capability of explaining the prediction, both data sets R2 are from the total sample analysis. In this regard although the authors may be able to draw adequate conclusions of the relevance of these two variables since for psychological based evaluations, having low values of R2 is normal, carefulness on conclusions might still be needed, provided that other means for the fit evaluation are not provided in the statistical evaluation, e.g. residuals analysis or root mean square of estimates (Minitab blog article, 2013).
Despite the R2 data, let’s take Kanzler, et al. (2011) conclusions to be valid, the question raised is: Why the pre-determined behavioral and cultural constructs did not reflect the expected hypothesis statistical observtion for the first two variables? The authors bring two possible explanations. The first explanation was that the PhD’s and professionals taking the survey were mainly young persons, which may represent a generational bias. The second explanation which might be more plausible was that rather than the individual’s culture, the predominant psychological construct might be influenced by the organization culture or expectations of the scientist alignment to the organizational expectations. The preamble to the study although proven by the empirical data to be contrarian by the results, showed a logic structure and their conclusions to prepare the hypothesis was fair. This indeed enforces the conclusions that these misleading cultural and phycological constructs are being challenged by strong circumstances, leading to the formulation of an appealing new hypothesis that requires additional empirical evaluation.
Linking. Kanzler, et al. (2011) article is well written, with a good reading flow and good understanding of the topic. The preamble to the study design showed good command of the prior cultural/psychological information. Regarding the exactness of the modeling aspect, the statistical analysis could had been improved by providing additional information for the model fit.
Case Study Application: Relevance of CSR, Network Working and Knowledge Management and Organizational Performance at Pfizer, Inc.
The information presented in the Unit 6 discussion and the extended discussion brought in this article with additional scholar research, indicates that CSR, network working, and knowledge management should have a significant impact on corporations that adequately play these business core components. Evidence collected at Pfizer, Inc. web page as well as external sources of information tend to indicate that indeed, Pfizer, Inc. masters the execution of adequate performance in these three business core component processes.
CSR at Pfizer, Inc.
Pfizer’s corporate responsibility programs are design to strengthen public health, access to medicines, philanthropic effort of Pfizer’s colleagues, disaster recovery and other programs (Pfizer’s Corporate Responsibility Program, 2019). Pfizer had elevated their CSR programs as one of the four corporate imperatives for future success, being, innovation, capital allocation, corporate responsibility and culture (Pfizer’s Annual Report, 2017). Some of the initiatives sponsored by Pfizer on their CSR program discloses amount of investment in this area, nevertheless, the total amount of investment on CSR program is not fully disclosed. For example, just in the employee’s community engagement program Pfizer, Inc. invested US $35 million in 12,000 nonprofit organizations. Based on the information provided in Pfizer’s web page Corporate Responsibility Program the amount investment in the community engagement program should be just a fraction of the total investment as could be appreciated by the many other programs including, product donation, and other means of support to these programs.
Network working programs at Pfizer.
Pfizer, Inc. had established many collaboration agreements with private and public institutions as well as spinouts from university research groups that collaborate in the creation of new drugs and disease treatment programs. (Pfizer’s Research & Development Collaborations, 2019). The objectives of Pfizer, Inc. with respect to network working and collaboration are very similar to the proposal brought by Melese, et al. (2009) where academic institution, government and industry, in this case Pfizer, Inc. establish new ways of creating innovative solutions to health issues, overcoming the financial hurdles explain in Melese, et al. (2009) article in what they call an R&D ecosystem of the future. Dr. Jose-Carlos Gutierrez-Ramos explain in his video clip that Pfizer’s current strategy is shifting from aa model that is based on bringing talent and doing research work internally with targeted interaction with external researchers, to a model where other component of the biomedical community are collaborating with Pfizer with the objective of creating new drug developments. The new model brings academia, patients association, venture capital, and regulators in a synergy to establish new interactions to accelerate of new drug discovery, enable new forms of funding, exploring new science and achieving new drugs (Pfizer’s Research & Development Collaborations, 2019). Based on these collaboration agreements with spinout companies Pfizer, Inc. had nourished their pipeline in core therapeutic areas like, mRNA vaccines with BioNTech Collaboration agreement, cancer immunotherapies agreements with Kineta Laboratories, and other agreements in the line of academic, disease advocate consortium like the Autism drug discovery (Pfizer’s Research & Development Collaborations, 2019).
Knowledge management and knowledge sharing at Pfizer, Inc.
Pfizer’s collaboration ecosystem programs are the best example of the company’s program on knowledge sharing, at least those that are made public (Pfizer’s Collaborations Ecosystem, 2019). The collaboration ecosystem is formed by three main strategic approaches:
- Research Collaborations; where Pfizer, Inc. is part of research centers, strategic alliances and consortia, like those discussed in the network working section.
- Targeted Business Development; where Pfizer, Inc. invest on emerging companies developing products or technologies that are expected to enhance Pfizer product portfolio.
- Innovative collaborations: This is a good example of using knowledge toward creating innovations, the Pfizer’s Center for Therapeutic Innovation (CTI) which is designed to bridge the gap between early scientific discovery toward drug development.
Pfizer’s case study summary and relevance to the three business core competencies
Pfizer’s strategies around CSR, network working, and knowledge management are well integrated into Pfizer’s strategic imperatives. The CSR is one of the four company’s strategic imperatives, and network working, and knowledge management are fundamental components of the Innovation imperative. The approach of Pfizer on integrating the Ethics, Human Resources and Information Systems organization’s structural components into their Strategic Imperatives project this organization as a leader in the biopharmaceutical business sector.
The financial strength of Pfizer, Inc. confirms that these strategies are successful strategies. Company financial growth, cost stability and steady profit increase, Table 1 shows a reproduction of Pfizer’s last three (3) years financial reports. The following highlights can be taken from that report that are relevant to the impact of Pfizer’s strategic imperative impact on their financials (Pfizer’s Financial Reports, 2014 and 2017).
- Revenues showed consistency year by year
- The percent cost of sales is being kept constant 19.7 to 23.3 % of revenues
- The percent cost of research and development is also being kept constant from 14.6 to 15.7 %
- While net profit showed a dramatic increase from 13.7 and 14.2 % in 2016 and 2015 respectively to an astonishing 40.6 % increase in 2017, driven by income from continuing operations and taxes benefits on 2017 vs previous years.
- Pfizer’s 2018-year end reports (Pfizer’s press release, 2019), showed that 2018 was in line to 2017 with respect to revenues with $53.6 B, and cost of sales of $11.2 B, and R&D Cost of 8.0 B, but a reduction in net income to $11.15 B from $21.3 B in 2017, due to the unfavorable tax provision paid in 2018 vs the favorable tax benefit received on 2017. Still an increase of on an adjusted income based was experienced by Pfizer in 2018, for 17.9 B in 2018 from 16.2 B in 2017 (Pfizer’s press release, 2019).

Conclusion
The interrelationship between ethics, HRM and IS processes like CSR, network working, and knowledge management was shown to be important aspects of organization’s business model. The additional discussion provided with the added scholar articles included in this assignment article showed that there is still a lot to learn about these topics. The additional discussion enhances the importance of these processes and structural components for organizations. The case study of Pfizer, Inc. showed excellent correlation of a company strategic imperative adoption of the CSR, network working and knowledge management processes in their core business model and their impact on the company’s business results.
References
Chesborough, H.W. (2003). Open innovation: The new imperative for creating and profiting from technology. Boston, Mass. Harvard Business School Press.
ECOS report (2010). Un-paid debt: The legacy of Lundin, Petronas and OMV in Block 5A, Sudan 1997 – 2003. Retrieved from: http://www.ecosonline.org/reports/2010/UNPAID _DEBT_fullreportweb.pdf
Graves, C. (2017). Why every ad today feels political (even if it isn’t). Harvard Business Review Digital Articles. Retrieved from http://library.capella.edu/login?url=http://search. ebscohost.com/login.aspx?direct=true&db=bth&AN=121278655&site=ehost-live&scope=site
Kanzler, S., Niedergassel, B. and Leker, J. (2011). Knowledge sharing in academic R&D collaborations: does culture matter? Journal of Chinese Entrepreneurship. V 4 (1), 6-19.
Khedhaouria, A. and Jamal, A. (2015). Sourcing knowledge for innovation: Knowledge reuse and creation in project teams. Journal of Knowledge Management, 19 (5), 932-948.
Lange, D. and Washburn, N.T. (2012) „Understanding attributions of corporate social
irresponsability”, Academy of Management Review, Vol. 29, No. 4, pp. 300‐326.
Lin, H-F. (2015). Linking knowledge management orientation to balanced scorecard outcomes. Journal of Knowledge Management, 19 (6), 1224-1249.
Lundin history in Sudan (2010, October): retrieved from https://www.lundinhistoryinsudan.com/ wp-content/uploads/2017/05/legacy-document_en.pdf
Melese, T., Lin, S. Chang, J.L. and Cohen, N.H. (2009). Open Innovation networks between academia and industry: an imperative for breakthrough therapies. Nature Medicine. V 15 (5), 502-507.
Minitab (2013, May 30). Regression analysis: How do I interpret R-squared and assess the goodness of fit [blog post]. Retrieved on 02-16-19. http://blog.minitab.com/blog/ adventures-in-statistics-2/regression-analysis-how-do-i-interpret-r-squared-and-assess-the-goodness-of-fit.
Pfizer Annual Report (2017). Retrieved from: https://www.pfizer.com/files/investors/financial _reports/annual_reports/2017/index.html?cid=vn_annualreport
Pfizer’s Collaboration Ecosystem (2019). Retrieved from: https://www.pfizer.com/ science/collaboration/collaboration-ecosystem
Pfizer’s Corporate Responsibility Program (2019, February 16). Retrieved from: https://www.pfizer.com/purpose/responsibility
Pfizer’s Press Release on 2018 Year end financial results (2019). Retrieved from: https://s21.q4cdn.com/317678438/files/doc_financials/Quarterly/2018/q4/Q4-2018-PFE-Earnings-Release.pdf
Pfizer’s Research and Development Collaborations (2019, February 16). Retrieved from: https://www.pfizer.com/science/collaboration/research-development
Popa, M. and Salanţă, I. (2014). Corporate social responsibility versus corporate social irresponsibility. Management & Marketing. Challenges for the Knowledge Society. V9 (2), 137-146.
Sanchez‐Runde, C.J., Nardon, L. and Steers, R.M. (2013) “The Cultural Roots of Ethical
Conflicts in Global Business”, Journal of Business Ethics, Vol. 116, No. 4, pp. 689‐701.
Vallaster, C, Lindgreen, A., and Maon, F. (2012). Strategically leveraging corporate social responsibility: A corporate branding perspective. California Management Review. Retrieved from http://web.a.ebscohost.com.library.capella.edu/ehost/detail/detail?vid= 0&sid=f17e062c-b6bf-4864-a248-d80ea90ab26e%40sdc-v-sessmgr03&bdata= JnNpdGU9ZWhvc3QtbGl2ZSZzY29wZT1zaXRl#AN=75273699&db=bth
Sourcing Knowledge for Innovation: Knowledge Reuse and Creation in Project Teams
This article discussed knowledge management from a perspective of innovation projects. Khedhaouria and Jamal (2015) proposed a hypothetical framework that is evaluated using a robust multivariate analysis method, which provides the basis for conclusions about the hypothetical statements and creation of sustainable postulates on the way innovation project teams should manage knowledge needs.
Main Points: Khedhaouria and Jamal (2015) bring three main points on their research on project teams’ knowledge management: Investigate how the different sources of knowledge are used and correlate to projects’ performance output
Investigate ways to facilitate the circular use and re-use of acquired knowledge in
- Investigate how team members are motivated toward sourcing and use of knowledge on their innovation projects
- creation of new knowledge
Evidence: Khedhaouria and Jamal (2015) used a hypothesis based quantitative study. The substantive data for this research study was collected from a survey designed using psychometric study statistics (Cronbach, 1951), and questions based on the experience of multiple researchers on similar topics, mainly Gray and Meister (2004).
The survey demographics were thoroughly described by Khedhaouria and Jamal (2015), including the sources of the survey respondents, the number of companies (417), location, sectors, the respondents’ age range, position in company, academic preparation, and years of tenure in their positions. In addition, the project topics were identified as: organizational changes. communication systems. software implementation, facilities, products and services development, and research and development projects.
Analysis: The structure of Khedhaouria and Jamal (2015) article follows a series of hypothesis testing that provides a progression of the survey data analysis using multivariable regression method, Partial Least Squares (PLS). The hypothesis testing approach is represented by a matrix of possible interactions between the learning orientation toward knowledge sourcing, knowledge creation and knowledge re-use. All possible combinations of hypotheses were examined based on three possible sources of knowledge that include sourcing from groups, knowledge repositories or the internet. A total of 12 different hypotheses were tested with the survey data. The hypothesis matrix and results of the statistical analysis were nicely summarized in the article (refer to figure 2, Khedhaouria and Jamal, 2015, page 941). In this figure, the authors provided the coefficient (β) for each hypothesis’ variable pairs, the t statistic and the probability level of each hypothesis pair. In summary, out of the 12 hypothesis pair combinations, 9 showed statistical significance that confirms the hypothesis. The model was found to be marginally acceptable from both the knowledge creation and re-use responses, with a level % R2 of 17 % for knowledge creation, and 9.1 % for knowledge re-use.
In summary the research of Khedhaouria and Jamal (2015) concluded the following theoretical points based on the hypothesis proof analysis:
- Investigation of team members’ knowledge motivator
- Learning orientation was found to be the single best motivator for team members’ knowledge creation and re-use (p values < 0.05). Knowledge creation had a relative higher magnitude of influence over knowledge creation when compared to knowledge re-use (βcreation= 0.252 versus βreuse=0.143)
- Learning orientation in relation to source of knowledge used, group, repositories or internet: The survey data analysis indicated that learning orientation is a strong motivator for information search from any source (all variables showing p < 0.001). The order of strength of the sources was sourcing information from group, followed by repositories and then the internet.
- Investigation of learning sources use:
- Sourcing from groups was found to be statistically significant to Knowledge reuse (0.01< p < 0.05) but was not significant to Knowledge creation (p > 0.05).
- Sourcing from knowledge repositories was found to be statistically significant for knowledge re-use (0.01< p < 0.05), but was not significant for knowledge creation (p > 0.05)
- Sourcing from internet was found to be statistically significant for knowledge creation (0.001< p < 0.01) while it was not significant for knowledge re-use (p > 0.05).
- Investigation of the re-use of knowledge in creation of new knowledge:
- The data showed a statistical significant response of knowledge creation as a function of knowledge re-use (0.01< p <0.05).
Khedhaouria and Jamal (2015) also provided a series of practical recommendations based on their study, including the awareness of this information by team leaders for improvement of their team’s knowledge sourcing practices. Also, the data collected in this study demonstrate that the composition of teams can be optimized by forming the teams with members with heterogeneity of skills. In addition, regular team meetings and conversations on practices and project execution issues improves knowledge sharing and cognitive improvements.
Linkage: The information provided by Khedhaouria and Jamal (2015), was nicely presented with strong design of study and results analysis. The approach started with a thorough analysis of the variables that affect knowledge management which were included in the survey analysis, this was clearly one of the most important elements of this article’s success. In addition, the authors showed a spirit of auto critic that can be used to further improve their work.
Linking Knowledge Management Orientation to Balanced Scorecard Outcomes
This article discusses knowledge management from a perspective of correlation to balanced scorecard outcomes. Lin (2015) proposed a hypothetical framework that is evaluated using a structured equation modeling (SEM) approach. This multivariate analysis method provides the evidence for conclusions about the hypothetical statements and creation of sustainable postulates on the relationship of knowledge management orientation dimension to business scorecard outcomes success.
Main Points: Lin (2015) brought one main point on this article; to demonstrate via a structured equation modeling approach that knowledge dimensions, including organization memory, knowledge sharing, knowledge absorption and receptivity can be correlated to balance scorecard outcomes like learning and growth, internal process, customer satisfaction and financial performance.
Evidence: Lin (2015) used a hypothesis based quantitative study to determine the correlation between the knowledge management orientation (KMO) dimension to the business scorecard outcomes (BSO). The substantive data for this research study was collected from a survey designed using psychometric study questions based on the experience of multiple researchers on similar topics. The questionnaire was designed to evaluate the effect of the KMO’s, organization memory, knowledge sharing, knowledge absorption and receptivity, against the BSO’s, learning and growth, internal process, customer satisfaction and financial performance. The questions used the 5 level Likert scale from 1 to 5 as “strongly disagree” for a score of 1 to “strongly agree” for a score of 5. The score value was used to define the quantitative score used in the model variable coefficient determination per study categories.
The relationship between KMO’s and BSO’s question groups provided the basis of hypothesis test pairs, to establish the significance of each KMO against each BSO and the BSO against other BSO. A total of 22 combinations of hypothesis pairs resulted from this analysis. The survey responses and demographics were thoroughly discussed by Lin (2015), the sample used for the SEM model was representative of 6 different industries at Taiwan for a total of 244 companies evaluated. The respondents were in majority senior members of the organizations and knowledgeable of the knowledge management process of their project teams.
Analysis: The model evaluation included a Chi-square test, which confirmed adequate model fit using various statistical tests, the goodness of fit was confirmed for each statistical test (refer to Table I and Table II, Lin 2015, page 1234). The statistical analysis that provided the coefficient for each hypothesis pair indicated that from a direct effect perspective the organizational memory relationship to the customer satisfaction and the financial performance, neither the effect of learning and growth relationship to financial performance showed a coefficient of correlation with p < 0.05. All other constructs showed correlation coefficients with statistical significance showing p values either < 0.05 or <0.01 (refer to Table III, Lin 2015, page 1235). On the other hand, when the direct and indirect effects of each hypothesis base are added, they all show statistical significant correlation coefficient.
The results obtained by Lin (2015) provided strong evidence of the effect of knowledge management orientation in business scorecard outcomes. The quantitative analysis performed provided a strong evidence, founded on robust statistical significance of the relationship between the KMO’s independent variables associated to the BSO’s dependent variables and covariation of the BSO’s as well. In conclusion, Lin (2015) indicates that their study strongly suggests that organizations must use learning activities and support innovative thinking on their project teams to reach project outcomes that enhance customer satisfaction and consequently improve their financial performance.
Link: Lin’s (2015) article was very well structured with information flow that was easy to follow. This article was structured like Khedhaouria and Jamal (2015). Actually, it appears to be a common structure used by this journal that makes the information flow similar between articles. The quantitative technique demonstrated statistical robustness, based on the different model statistical evaluation criteria used. Lin (2015) also made a nice self-critique of her work including elements that need to be further evaluated like longitudinal research needs, analysis cross-industry or cross-country analysis.
Comparative Analysis of Articles and Application to a Fortune 500 Company
These two articles, Khedhaouria and Jamal (2015) and Lin (2015), provided a quantitative analysis of the knowledge management concepts that provided original and peer reviewed evidence of the relationship between elements of knowledge management and the process of sourcing knowledge and creating innovation (Khedhaouria and Jamal, 2015), as well as the orientations of knowledge management that relate to business scorecard elements. They both used different quantitative approaches but reach equally useful conclusions. Khedhaouria and Jamal (2015) use a PLS methodology, which produces elastic? evaluation of the independent and dependent variables set for the study, while in the case of Lin (2015) the structured equation modeling (SEM) establishes variable relationships including dependent and independent variables regression and co-variance analysis of the dependent variables for each hypothesis pair. Both methods showed adequate statistical robustness in the evaluation of the variables’ relationships.
Let’s use the example of Pfizer, Inc. to illustrate the adequacy of the conclusions made by Lin (2015) on her hypothesis testing. Based on Lin’s hypothesis test, there is a statistical significance between the direct effect of knowledge sharing and learning and growth (0.26, p < 0.01), internal process (0.43, p < 0.01), customer satisfaction (0.19, p < 0.05) and financial performance (0.21, p < 0.05). Projecting these results, it could be hypothesized that Pfizer, Inc., which is showing excellent financial performance and customer satisfaction, should have robust knowledge sharing strategies that promote learning and growth and superior internal processes.
Looking at Pfizer’s SWOT analysis (MarketLine SWOT analysis, 2018), Pfizer’s strength derives from a strong innovation platform, that is fundamentally related to their business knowledge base. Opportunities being pursued by Pfizer are nourished by strategic collaborations which implies heavy knowledge base sharing with partner companies. Based on Pfizer’s financials, their approaches on knowledge management, showed to be successful. Between 2016 and 2017 Pfizer, Inc. experienced an operating margin increase from 17 % to 24.7 % a significant increase in the company’s profits that could be the envy of any industry.
Conclusion
The adoption of knowledge management practices by innovation project teams was thoroughly evaluated in both Khedhaouria and Jamal (2015) and Lin (2015). Lin’s article provided a strong demonstration that companies’ business scorecard outcomes are strongly correlated to knowledge management orientation. These two points of view in the knowledge management arena complemented each other well and provide a path to establish practical approaches to improve companies’ knowledge acquisition and use for performance improvements. Pfizer, Inc. showed to be a good example where knowledge management practices lead to creation of innovative medicines. This company is characterized by a strong partnership culture, where knowledge exchange results in synergies that maintains their stance as a pharmaceutical industry innovator.
References
Cronbach, L.J. (1951). Coefficient alpha and the internal structure of tests. Phychometrika, 16 (3), 297-334. Retrieved from; https://pdfs.semanticscholar.org/e985/ac2e151903000 cac310ffbc5b2cb4fbb9dd5.pdf
Gray, P.H. and Meister, D.B. (2004). Knowledge sourcing effectiveness. Management Science, 50 (6), 821-834.
Gray, P.H. and Meister, D.B. (2006). Knowledge sourcing methods. Information & Management, 43 (2), 142-156.
Khedhaouria, A. and Jamal, A. (2015). Sourcing knowledge for innovation: Knowledge reuse and creation in project teams. Journal of Knowledge Management, 19 (5), 932-948.
Lin, H-F. (2015). Linking knowledge management orientation to balanced scorecard outcomes. Journal of Knowledge Management, 19 (6), 1224-1249. MarketLine (2018). Company profile, Pfizer, Inc. SWOT analysis. MarketLine Reports. Retrieved from, http://web.a.ebscohost.com.library.capella.edu/bsi/pdfviewer/pdfviewer ?vid=8&sid=914990b8-56c5-448e-ab18-152bf21d4b68%40sdc-v-sessmgr03
In this article, the author presented 10 companies that reached the status of breakthrough brands in 2017. (Gallagher et al., 2017)
The main point is precisely how these recently created companies, most of them 10 years or less, had attained breakthrough brand status in such a short time.
The evidence provided comes through the quantitative technique of a survey, which was run on a sample of 4000 customers. The authors asked these customers which were the brands that meant the most to them. Information collected in the survey was presented on the discussion of each of the companies that reached the top 10. In addition, the authors mention the position of what they call “all-star” brands, which are the not so young companies that still capture consumer mindshare.
The results of the survey were analyzed by industry, category, and age of companies. The 10 companies reaching the top of the list were technological companies, and 8 out of them were less than 10 years old. The 2 older companies were 11 and 14 years old, still very young at the time of the survey in 2017.
An important concept brought in this article is that the data provided by the surveys indicates that digital transformation is a main driver for the companies’ breakthrough status. Most of the brands identified in this survey are e-based, which means a lot with respect to the penetration of e-commerce in the general public. That so called technological barrier is no longer such. This is thanks to the proliferation of smartphones and other means of cheap or free and accessible digital tools (Gallagher, L. et al. 2017).
The ten younger companies reaching status of breakthrough brands were: AirBnB, Instagram, Slack, Snapchat, Spotify, Square, Tesla, Uber, Venmo and Waze. These companies are position similarly to the predominant brands that still have significance despite being older than these younger players. The brands that are older and still scored high on the survey are also important to mention. The top 10 out of the survey that are established, and older companies were: Apple, which was mentioned 3 times more than the next rival which was Walmart, followed closely in the pack by Google, Amazon, Samsung, Microsoft, Toyota, Ford, Target, and Coca-Cola. The article was nicely structured, being a trade magazine, the presentation is neat presenting nice graphics and a nice layout of the information. The information is also well organized, its flow was adequate, and it is a relaxed way of presenting a quantitative analysis of branding aspects.
In this article the authors aimed to demonstrate the value of the marketing function in companies (Hanssens and Pauwels, 2016). This peer-reviewed article brought many topics to the analysis, as well as suggestions for future research. The authors provide a deep discussion of points with plentiful evidence based on empirical data. The following main points were discussed:
- The difficulty of the marketing value assessment
- The influence of marketing objectives on marketing value metrics
- Methods and findings; about assessing marketing value
- Communicating marketing value within the organization
All these topics are explored by the authors using the rigor of scholar analysis of prior investigations by others, and their own research data. The following is a description of Hanssens and Pauwels’ work for this article defining each main point and touching upon relevant sub-topics, the evidence provided on the discussion and the analysis provided.
The difficulty of the marketing value assessment. The marketing profession is a difficult one, with challenges related to demonstrating the value of marketing efforts in a product line’s sales profit and growth, as well as the misconceptions surrounding their profession and the primacy of other company functions, such as finance (Zorn, 2004). The concern for Hanssens and Pauwels throughout this article is why marketing is so difficult to assess. Providing reasons for this, they bring several root causes for this main point:
- The relationship between metrics is not well understood. For this they presented evidence from research work that indicates that metrics are usually moving in complex relationships that are often nonlinear and poorly correlated. They mention specifically research by Stahl et al. (2012) on product differentiation, which tends to be related with higher profitability and at the same time lower customer acquisition and retention rates (Stahl et al., 2012).
- The difficulty of understanding the connections between metrics makes it difficult for researchers to consolidate the accumulated knowledge base, and even more difficult for companies to select metrics that are meaningful for their objectives.
- Connecting metrics is important for a thorough understanding of the value of marketing and understanding the profit function as a multivariate or elastic function (Hanssens and Pauwels, 2016)
- Reaching the goal of assessing marketing value correctly requires good performance metrics, causal links between the metrics, and communication of the analysis done on these linked metrics. This is the essence of the rest of this article discussion.
The influence of marketing objectives on marketing value metrics. The importance of this main point is directional. Companies need to assess their needs and expectations from the results of marketing efforts. To accomplish this, marketers need to be clear in four main aspects from the marketing effort perspective:
- Reconciling different marketing objectives. It is important to recognize that increased profit is not the only objective of a marketing campaign. Multiple objectives may need to be accomplished in marketing that might be contradictory. For instance, Hanssens and Pauwels bring evidence to this point from Natter (2007), who performed a case study analysis that describes the need for the reconciliation of multiple objectives. The study focuses on a retailing company (name not disclosed), where a profit optimization campaign needed to be modeled considering the impact of price changes on demand against volume-based discounts provided by suppliers. Looking at both components of the equation, the volumes and price combined function resulted on the optimization of the market share objective of the company.
- Effectiveness and efficacy. There is a significant difference between effectiveness and efficacy in marketing campaigns. Often you can’t get both; for instance, a campaign based on social media might be efficient, less costly, but may not be effective due to limited access of social media for some customer sectors. On the other hand, a broad public campaign should be very effective in customer contact but is more expensive (Hanssens and Pauwels, 2016).
- Defining the scope of marketing. This sub-point example comes from work done by Webster, Malter, and Ganesan. (2003), where they discuss the impact of marketing organizations around their stiles of marketing scope. Marketing scope can be limited or broad. Limited scope refers to marketing campaigns that are prepared by small marketing organizations, rather simpler approaches like an advertising campaign. This usually occurs in organizations that are small, subsidiaries of bigger companies, engineering product focus or business to business companies. The broad marketing scope is the big marketing function of companies that consider the marketing function a profit driving operation center. These are mainly big corporations with significant consumer focus; the example or evidence provided by the authors is Procter & Gamble and Diageo (Pauwels, 2014). The authors acknowledge that most companies fall in something in between.
- Marketing Budget vs. Allocations. The relationship between these two financial concepts greatly impacts an organization’s marketing function. The analogy given is that for a CEO the CMO budget of 100 MM is an investment. For the CMO team the distribution of those 100 MM between the function groups represents an allocation, which is used to drive the tactical aspects (Mantrala, Sinha, and Zoltners, 1992). Quantitative evidence is brought through studies like Sorescu and Spanjol (2008), who performed an empirical study on the effect of product and process innovation, both strategic actions, and their effect on company growth.
Methods and Findings About Assessing Marketing Value. The analysis of marketing is a science, it is currently looking into elasticity functions and relational functions that permits a meta-analysis of the market information collected from adequate metrics. The authors brought a progressive presentation of the deep analytical tools they and other authors have developed. The following sub-points describe the analytical methods used by mostly academic authors.
- Methods, models, surveys and experiments. The market impact of marketing campaigns can be assessed using two types of data: primary data, which is the data collected in empirical testing methods such as surveys and experiments. And secondary data, which is the historical data available from the different market analysis metrics (Hanssens and Pauwels, 2016). The two types of data differ on the depth of inferences that can be drawn from them. Primary data is useful to establish causal relationships between the independent variables (metrics) and the dependent variable, which is the marketing study’s subject (profit, sales, market share, or other). Relational information can be drawn from experiments. In addition, primary data collected from surveys can provide the information on “the reason why” (Hanssens and Pauwels, 2016). Secondary data analysis is readily available, as recent advances on statistical software, on descriptive statistics techniques and multivariate analysis techniques have made the interpretation of data more accessible and faster than the collection of primary data (Hanssens, 2014). According to Hanssens and Pauwels (2016), the best information about markets’ aspect of interest will come from a study that combines both primary and secondary data. Evidence of this comes from a study performed on the furniture company Inofec (Wiesel, Arts and Pauwels, 2011), where the authors performed initially a metrics-based model simulation combined with an experimental design that provided final optimized conditions for marketing channel mix between two options, paid search and direct mailing.
- Findings on marketing investments and allocations. Further insight is provided on the impact of budget process from the strategic perspective and tactical execution. When budget process is seen in a strategic way and marketing is seen as an investment, the usual intended result is to have profit growth. The analysis of model’s elasticity reveals that actions on the realm of strategic perspective, such as innovation and differentiation of brand and customer assets, will produce organic growth. On the other hand, tactical actions, like advertising and price promotion, will contribute little to organic growth but will promote profit improvements (Dorfman and Steiner, 1954, Hanssens and Pauwels, 2016, table 3, p 180).
- ● Connecting and integrating soft and hard metrics. Having an integrated perspective of the market information domains of soft aspects (attitudinal metrics) and the hard aspects (behavior and performance metrics) shall result in excellent model tools for marketers. Few studies were identified by Hanssens and Pauwels on their article. Evidence provided includes a study by Pauwels and Van Ewijk (2013), who performed an analysis of the effect of online behavioral metrics and attitude survey metrics on brand sales.
- Dealing with risk. Knowledge of marketing value elasticity variables promotes the CMO’s ability to predict and therefore learn how to deal with risk. The use of well-developed models can help the CMO project critical financial metrics out of market data under different economic circumstances, modeling them and returning with recommendations to the CEO for data-based decision making (Pauwels, 2014).
Communicating marketing value within the organization. The fourth main topic discussed by Hanssens and Pauwels (2016) on this article were the dimensions of communicating the value of marketing to an organization. The evidence provided proves that there are three different perspectives on the communication process that marketers need to understand and implement.
- Communicating marketing objectives in data dashboards. Communication is key to business success and key metrics are usually established to communicate indicators of business performance. Business data and the use of performance predictive metrics, including those that assess marketing, should be an aid rather than a menace to marketers’ jobs, as people and data have complementary usefulness (Blattberg and Hoch, 1990). Analytical marketing dashboards are an excellent tool for communicating key marketing metrics that take into consideration the data and human intelligence (Pauwels et al., 2009). Dashboards enforce consistency by helping to monitor performance, goals and strategic planning, and can be used to communicate with important stakeholders.
- Adapting communication to the style of the decision maker. Dashboards can be adapted to the decision maker’s style, for instance, analytical decision makers can be delighted by models and elasticity relationships. On the other hand, an intuitive decision maker can adapt better to data presented with visual aids like charts or graphs (Hanssens and Pauwels, 2016).
- Adapting communication to the marketing organization. This topic is a matter of inclusion, where decision makers need to consider the voice of the shop floor resources, in this case the market analyst. An example of a case study evidence was brought to discussion, specifically how a venture capital company uses a model algorithm in their board of director’s decision making. Curiously this article mentions that the company named the algorithm as a member of the board of directors (Wile, 2014).
Hanssens and Pauwels’ article was structured with a robust and logical order of information that deals nicely with, first, establishing an understanding of the problem of assessing the value of marketing, followed by the perspectives of the metrics that better suit the marketing objectives, how to model them and ending with the communications strategies. They showed a clear progression of information for each main topic. They presented their arguments on each topic, evidence and examples, and provided a structured and substantiated analysis of the topics. The authors make a good progression of concepts, moving from the simple metric use to the more complex modeling interpretation of them. The communication aspect was a great complement to the very dense data-driven discussion in the modeling section.
References
Blattberg, R.C., and Hoch, S.J. (1990). Database models and managerial intuition: 50 % model + 50 % manager. Management Science, 36 (8), 887-899.
Hanssens, D. M., & Pauwels, K. H. (2016). Demonstrating the value of marketing. Journal of Marketing. http://web.a.ebscohost.com.library.capella.edu/ehost/pdfviewer/ pdfviewer?vid= 1&sid=ebac00fc-deba-4bb8-a01f-0b75197807e0%40sdc-v-sessmgr03
Mantrala, M.K., Sinha, P., and Zoltners, A. A. (1992). Impact of resource allocation rules on marketing investment-level decisions and profitability. Journal of Marketing Research, 29, 162-175.
Pauwels, K.H. (2014). It’s not the size of the data It’s how you use it: Smarter marketing with Analytics and Dashboards. New York: American Management Association.
Pauwels, N.K., Ambler, T., Clark, B., LaPointe, P., Reibstein, D., and Skiera, B. (2009). Dashboards as a service: why, what, how and what research is needed? Journal of service research, 12 (2), 175-189.
Stahl, F., Heitman, M., Lehmann, D.R, and Neslin, S.A. 2012. The impact of brand equity on customer acquisition, retention and profit margin. Journal of Marketing, 76, 44-63.
Zorn, D. M. (2004). Here a chief, there a chief: The rise of the CFO in the American firm. American Sociological Review. http://web.b.ebscohost.com.library.capella.edu/ehost/ pdfviewer/pdfviewer ?vid=11&sid=de256f36-d3ed-4263-bea8-839693715c83%40pdc-v-sessmgr03
An important aspect of a business is to have a sense of direction and identity, which can be achieved by the formulation of a strategy and a business model. In this post I will discuss the principles of making a business model brought by Andrea Ovans in her article “What is a Business Model?” (Ovans, A. 2015) and the Harvard Business Review (HBR) video and article authored by Alex Osterwalder “A better way to think about your business model” (Osterwalder, A. 2013).
On her article, Andrea Ovans discusses the Business Model concept evolution starting with a discussion of Michael Lewis book (Lewis, P. 2000), who compares a business model to a work of art, which you may find good or not so good. Ovans starts to make connections to other business thinkers like Peter F. Drucker (Drucker, P.F. 1993) who proposed the concept that a business must be defined based on the assumptions of what a business does to make money, a definition that Michael Lewis also shares, particularly looking into the dot.com era where many companies didn’t really have substance on their business assumptions and where they intended to make money on poor substantial terms.
Another attribute of the business model brought by Ovans on her article is the framework to the business model as a set of assumptions on what businesses do and what they don’t do. Assumptions around what businesses do or don’t do are key to their operation, and lead to the understanding of what a company is created for. This concept was shared by Drucker (Drucker, P.F. 1993) and later by Michael Porter when he refers in a similar way to the definition of strategy (Porter, M. 1996). The discussion of the similarity or differences between strategy and business model is an interesting topic as these business terms were initially used indistinctively, nearly as synonyms (Da Silva, C. 2014).
Assumptions of a business are subject to evolution; an assumption that was made at the company’s first business model might not hold forever. Changes in business environment will occur and the business model must adapt to those changes. Ovans brings from Drucker’s article a discussion of IBM as a good example of a company forced to change their business model assumptions as the business environment changes (Drucker, P.F. 1993).
The business model should provide a thorough description of the customer and the value chain that fulfills the customer’s needs. Ovans discusses additional references that emphasize on these topics. She continued with Joan Magretta who further discussed these concepts (Magretta, J. 2002). To Magretta a company business model should tell a story, which starts with the primary focus of a business, understanding their customers. It should answer the questions: who is the company’s customer? What are the customer’s likes, what do they value? On the value chain aspects Magretta emphasizes on the “make” and selling aspects. The business model should be able to explain to the floor manager: How do we make money on this business? How do we bring value to our customer? By which means? How we can do our business in a cost-effective way to allow for lower prices to the customer? On the sales perspective the business model emphasis should be on finding and reaching customers, enabling a transaction, distributing the product or delivering a service.
To further emphasize on the business model construction, Ovans conveys the work of Alex Osterwalder, defining his proposal of a business model canvas (Osterwalder, A. 2013). Osterwalder’s work aligns very well with the points brought by Michael Lewis, Peter Drucker and Joan Magretta, but goes a step further. Osterwalder develops this system to organize and analyze in a holistic perspective a company’s business model. The business model canvas consists of a series of assumptions organized in a very structured manner that allows the visualization of the underlying principles of business functions and their interactions. The business model canvas brings a fresh way of looking at a company at a glance and is an excellent tool to either initiate or re-formulate a business. It consists of 9 building blocks that explain how a company works. The building blocks are:
- The Value Proposition
- The Customer Segments
- The Channels by which the customer will get the product
- The Customer Relationships
- The Revenue Streams
- The Key Resources
- The Key Partners
- The Key Activities
- The Cost Structure
Ovans shares how a business model can be used also as a business evaluation tool. Magretta makes a distinction between the business model and a business strategy (Ovans, A. 2015, p 4). This discussion is at a central stage in Magretta’s article (Magretta, J. 2002). Answering the question “what about strategy?” Magretta points out that the central point of a business model is a description of how the business runs, while in a business strategy the companies are interested in knowing how they can do better than their competitors.
Moving forward into what a business model can do, Ovans brings the point of using business models to modulate a company stance on business. Clay Christensen’s article (Christensen, C. et al. 2008) and HBR video “The Explainer: Disruptive Innovation” explores the concept of how established companies need to reconsider their business assumptions once an innovator company brings a product innovation that takes a significant market share. To succeed, the established company needs to make a disruptive innovation of their own that changes their business status quo after the innovator penetration. Christensen recommends creating a separate business unit to prepare the new business model with their own objectives and business expectations. Other scholars argue similar points and reinforce the need for adaptation as a key element of a business model. In her HBR spotlight-interview (HBR-editor spotlight, 2011) “When Your Business Model is in Trouble” Rita McGrath discusses the aspect of a business model not fulfilling its expectations. When companies start to perceive that despite innovations in their product the impact on the customer is minimal, and their people are running out of ideas, it is time to make drastic changes in the business model. Paraphrasing McGrath on her interview, the problem is that companies tend to keep doing the same thing all over again. They are like a big wheel’s inertia, when starting it is difficult to get it moving and when it moves it is difficult to stop.
Ovans also discuss the opinion of other authors and their suggestions on specific changes that can be pursued to revitalize a business model. Karan Giotra, and Serguei Netessine (Giotra, K. and Netessine, S. 2014) indicate four critical aspects of a business model that upon change can help re-direct companies, these are:
- Changing the mix of products or services
- Modifying the decision-making process:
- Postponement of decisions
- Replace the decisions makers
- Modifying incentives in the value chain.
Ramon Cassadesus-Masanell and Joan Ricart (Cassadesus-Masanell, R. and Ricart, J. 2011) emphasize on the design of a business model based on a decision-making process that considers 3 major elements:
- Decisions on company policies; what labor policy the company will follow (unionized vs non-unionized), employee expenses policies (travel restrictions), where plants are located.
- Decisions on assets; machinery, manufacturing facilities
- Decisions on company governance policy; arrangement of decision making rights
In addition, Ovans brings examples of business model strategies created by Mark Johnson in his book “Seizing the white space: Business model innovation for growth and renewal,” a table showing different styles of business model analogies from which to pick as examples for companies to build their own business model value proposition. The list of analogies consist on a series of forms or classes of business, the mechanics of how they work and examples of companies that belongs to that form of business. For example, a form or class of business is an “Affinity Club”. The way they work is by paying royalties to some large organization for the right to sell your product exclusively to their customer. The company example given is MBNA a holding company specialized in affinity credit cards (Company Spotlight: MBNA Corporation, 2004).
Another topic I want to discuss in this post is the concept of the five competitive forces of business that HBR brings in their video series “The Explainer: Porter’s Five Forces” (HBR Producer, 2014). The video explains Michael Porter’s concept of the five forces that drive competition between companies. The five forces define company’s competition for profitability as follows:
- Buyers: the influence of buyers or customers drives competition because buyers want to get more from a product while paying less. The airline sector is an example where buyer forces show to be an important factor in price competition between airliners.
- Suppliers: the company suppliers force wants to have greater earnings from fewer products or services provided. Powerful suppliers will insist on having the most favorable terms possible on their business. In the airline sector this translates to, for instance, suppliers of aircraft or aircraft components which have a great stake of airliners expenses. Also, unions are a significant factor of labor supply that exert tremendous pressure to the airliners operations.
- Substitute products and services: in fulfilling a need, customers may have options that may not be in the same business as one’s product. The substitute products or services force may affect a business when the customer’s need is less differentiated and multiple options are available even between sectors. In the airline sector example, the customer has other options like driving a car, taking a train and maybe in the future flying drones or comfortably seat in an autonomous car.
- New Entrance: new participants in a business sector, particularly in sectors where business entry factors or constrains are less, is another competition force to consider. In the case of the airliners, business entry is relatively easy, and many small companies emerge. This is the case brought in the video of Southwest Airlines which challenged the industry by having a single aircraft vendor and model approach, where they can leverage on equipment cost.
- Existing Rivals: sectors may have many rivals who compete for the same market and irremediably share the stake of customers. Again, in the airline sector there are many airlines that have worldwide presence and competition is actually global for essentially the same customers.
The five forces provide a framework to understand business environment pressures and how companies interact with these forces in the effort of making profit. It also provides a system by which companies can measure themselves an establish strategies for improvement on their business and increase their earnings. In relation to the article from Ovans (Ovans A., 2015), the five forces can be an adequate addition to the options a company can use to understand their business environment in preparation for their business models.
In conclusion, a business model reflects what a company must do to be profitable. It is based on assumptions made on the business to guide the business components’ integration and success in making profits. In combination with a strategy, a business model complements the actions taken by a company into their resilience and ability to survive in an ever more competitive business environment. As a company becomes aware of its own assumptions and follows expert guidance such as those brought by Andrea Ovans in her article, the higher the probability that it will be successful in making profits.
References
Ovans, A. (2015). What is a Business Model? Harvard Business Review Digital Articles. http://web.b.ebscohost.com.library.capella.edu/ehost/detail/detail?vid=0&sid=21250346-7166-4b95-93ec-104faee06d79%40pdc-v sessmgr06&bdata=JnNpdGU9ZWhvc3 QtbGl2ZSZzY29wZT1zaXRl#AN=118648215&db=bth
Osterwalder, A. (2013). A better way to think about your business model [article video]. Available from https://hbr.org/2013/05/a-better-way-to-think-about-yo
Lewis, P. (2000). The new new thing: a silicon valley story. New York, NY, W.W. Norton & Company, Inc. http://web.a.ebscohost.com.library.capella.edu/ehost/ebookviewer/ebook/ bmxlYmtfXzMyNjcyX 19BTg2?sid=91f23cca-cf1e-4781-be2ff2705bc6c8e1@sessionmgr 4010&vid=0&format=EB&rid=1
Drucker, P.F. (1993). The Theory of the Business. Harvard Business Review Digital Articles. https://hbr.org/1994/09/the-theory-of-the-business
Porter, M. (1996). What is strategy? Harvard Business Review Digital Articles. https://hbr.org/1996/11/what-is-strategy
Da Silva, C. and Trkman, P. (2014). Business model: What it is and what it is not? Long Range Planning, electronic source. https://www.sciencedirect.com/science/article/abs/pii/S0024630113000502?via%3Dihub
Magretta, J. (2002). Why business models matter. Harvard Business Review Digital Articles. http://web.b.ebscohost.com.library.capella.edu/ehost/pdfviewer/pdfviewer?vid=22&sid=b6dd3523-d2b1-4ee0-ba57-21bd6f7b4aa6%40pdc-v-sessmgr01
Johnson, M., Christensen, C.M., and Kagermann, H. (2008). Reinventing your business model. Harvard Business Review Digital Articles. http://web.b.ebscohost.com.library.capella. edu/ehost/pdfviewer/pdfviewer?vid=25&sid=b6dd3523-d2b1-4ee0-ba57-21bd6f7b4aa 6%40pdc-v-sessmgr01
Harvard Business Review (Producer). (2013). The Explainer: Disruptive Innovation
Available from https://hbr.org/video/2688242135001/the-explainer-disruptive-innovation
Harvard Business Review (Producer). (2011). When your business model is in trouble. [Interview] Available from https://hbr.org/2011/01/when-your-business-model-is-in-trouble
Giotra, K. and Netessine, S. (2014). Four paths to business model innovation. Harvard Business Review Digital Articles. https://hbr.org/2014/07/four-paths-to-business-model-innovation
Cassadesus-Masanell, R. and Ricart, J. (2011). How to Design a Winning Business Model. Harvard Business Review Digital Articles. https://hbr.org/2011/01/how-to-design-a-winning-business-model%20
Harvard Business Review (Producer). (2014). Explainer: Porter’s Five Forces
Available from https://hbr.org/video/3590615226001/the-explainer-porters-five-forces
MarketWatch: Global Round Up (2004). Company Spotlight: MBNA Corporation. http://web.b.ebscohost.com.library.capella.edu/ehost/pdfviewer/pdfviewer?vid=5&sid=38c8e0c8-9b8d-4615-93ea-3c8efcd66bff%40pdc-v-sessmgr01


