

The article from Battersby (2013): Funding your business expansion, provides a series of recommendations around financing strategies for small business. It explains the different options of finance that a small business can reach for a business expansion.
Main Points: The main point brought by Battersby (2013) on his article is that for a growing small business many financial risk should not be a deterrent for business owners expansion ideas, as careful evaluation of existing financial sources can help select the right borrowing strategy to achieve their goals on reaching a competitive advantage.
Evidence: The evidence provided in Battersby (2013) is based on documented financial programs that are available for acquiring debt. He also explains the financial strategies based own knowledge or experiences as citations are not provided in the article.
Analysis: Battersby (2013), started his article by clearly indicating the problem that many small business owners have while evaluating getting into a business expansion opportunity. The risk of cashflow issues is one of the major deterrent of business owners on considering an expansion, mainly as a fear of committing income to borrowing paybacks could affect their cashflow. Battersby brings a series of options to consider when in need for borrowing as alternative options that a small business owner can consider rising expansion funds. The following were the options given:
- Do-it-yourself: This is the use of equity build by a company to finance business expansions. Instead of distributing the stockholder’s equity in the form of dividends, agreements can be reached with the stockholders to use this money to make the expansions that will eventually pay off as business profit growth.
- Equity financing: This is selling a portion of the company’s stocks to investors in exchange of funds for expansion. Constrains includes first convincing the investors of an eventual equity premium is viable and the fact of losing part of the control of the company’s decision making to an outsider.
- ESOP option: Employee Stock Ownership Plans (ESOP) is a way of finance where the employees are offer participation on the company equity through a financial plan that pay off for the investment. The company issue a package of shares of stocks and sell it to the ESOP. The ESOP usually borrow money to buy the stock and the company uses the money to invest on the store expansion. The company re-pay the agreed amounts to the plan which are tax deductible.
- Bank borrowing: Usually consider for the short term borrowing needs, working capital to improve cash flow and long-term capital expenses financing.
- Government loans: Usually from the US small business administration (SBA), loans are available for small business growth opportunity, that requires less stringent requirements on collaterals as bank borrowing, and long-term payback periods.
- 504 Loan Program: Is a top end lending program from the SBA that allows higher amount borrowing for long term investments, usually on real estate and machinery. These loans are made with intermediaries call certified development companies (CDC’s) which are not for profit intermediaries that work with the SBA, banks and businesses on their financial needs.
- Local funds: funds available through local or regional economic development agencies. The charter of these agencies is to facilitate economic development at the communities they serve, in that objective, financial assistance of small business should be part of their offerings.
Linkage: The article has a nice flow and logic progression. It provided clear information with words of advice intercalated on the different financial options discussed. The article logic is set for a light, informative reading that could spark the interest of a reader on finding additional information on financial strategies.
Strategy in the age of superabundant capital
This article discusses organization’s strategies for growth in a financial environment where capital may not be a constrain to consider when opportunities come. Mankins, Harris and Harding (2017) brings a historical recollection of the financial landscape changes that occurred in the last three (3) decades ending at the current times where cost of capital is at a low point and provides a discussion on how organizations can take advantage of this favorable financial landscape.
Main Points: The main point of this article is that capital availability at low cost provides an excellent opportunity for financing growth projects based on two main strategies, lowering hurdle rates and managing well the human capital.
Evidence: Mankins, et al. (2017) based their article in data from their research on financial market indicators. The evidence provided included the following indicators information:
- Growing financial markets in emerging economies: capital super abundance is supported by the growth of emerging economies like China and India
- Expanded number of high end savings: demographics advantage of population at ages of 45 to 59 which contributes with their savings on the available capital funds.
- Cost of equity: In the last three (3) decades a consistent decrease in cost of capital had reach the lowest point in 2015 at a rate of 5.3 %. (Mankins, et al., 2017, figure titled “how the cost of capital has evolved”, page 70)
- Return on growth investment: with the lower cost of capital, investment on growing opportunities are prone to deliver higher returns. (Mankins, et al. 2017, figure titled “choosing a strategy: profitability or growth”, page 70). Mankins, et al. 2017, provided a couple of examples of companies making multiple projects on growth that show excellent returns of investments, (e.g. WPP a marketing company and 3M a materials and consumers products company).
Analysis: Upon discussion of the reasons why capital is superabundance and should keep like in the near term, Mankins, et al. (2017) started a discussion of the strategies that organizations must follow to take the advantage of the lower capital cost for business growth. Their recommendations were the following:
- Reduce hurdle rates: company’s standards for the evaluation of project’s business cases should consider the lower cost of capital and minimize the percent rate used in the determination of financial indicators like Net Present Value. If companies keep higher rates for the assessment projects they would be overly conservative in their determinations of cashflow benefits of a project and may reject projects that otherwise are viable.
- Focus on growth: at lower cost the return of investment of growth projects should be higher than that of profitability projects. The examples provided by the authors on WPP and 3M show the profit increase tendency of sponsoring multiple growth projects.
- Invest in experiments: with super abundant capital managers can increase their risk taking by experimenting with new ideas at a higher rate. Example given was Alphabet which embarks in multiple ventures some of which are successful and other not. The key is to identify exit rules to minimize loses on non-successful projects.
- Human capital: if capital is not an issue what then becomes an issue is the ability of an organization resources of inventing new growth opportunities. Managing human capital in this case become critical for growth opportunities. Talent people is the fundamental source for organizations competitive advantage, promoting significant higher productivity in growing settings.
Since the date at which this article was published on March 2017, uncertainty on the financial market had started to build up by the Federal Reserve Bank prime rate increases. Rates at March 2017 where 4 % versus current rate which is 5.5 %, with expectations of a continued increase by the federal reserve (Fed Prime Rate, 2019). The question is, how long will low cost capital will last and what impact the rates increase will have on companies’ growth?
Linking: Mankins, et al. (2017) article had a nice reading flow with relevant knowledge progression and logic approach to the arguments they brought. The approach they follow on the analysis of the financial landscape is very well substantiated by data. Evidence provided was substantial and in line with the progressive evaluation that the authors brought on the topic.
Finally, proof that managing for the long term pays off.
The last article on this discussion is from Harvard Business Review, Barton, Manyka & Williamson, 2017. This article provides an analysis of companies’ financial metrics that according to the authors is capable of distinguishing companies that have sustainable growth based on long term investment planning to those that prioritize the short term.
Main Point. The main point of this article is the description of a quantitative method that can measure the long-term strategies adherence on profitability and growth.
Evidence. The corporate horizon index, is a multivariate index based on financial data from a substantial number of companies created by a group form by MGI, McKinsey group, Harvard Business School Strategy and Corporate Finance and FCLT Global. The proprietary index was created on a survey study of 60 to 65 % of US Public market capitalization companies over the study period (2001 to 2015). The report referenced by Barton, et al. (2017) provided additional information from the variables used, which included investments, growth, earnings equity and earnings management (McKinsey global, 2017).
Analysis. The analysis of the variables described by Barton et al. (2017) provided a distribution of the companies analyzed in two group. One group that operates on the long term (164 companies, 27 % of the sample), and the second group of 451 companies (73 %), operates in the short term. The analysis of revenues on the two groups revealed differences that were significant and demonstrated the benefit of operating in the long-term strategy. Companies in the long term showed:
- 47 % more revenue when compared to the short-term companies
- 36 % higher earnings when compared to the short-term companies
- Less volatility on revenue growth, standard deviation of 5.6 vs 7.6 on the other companies
- Higher investment rate on R&D
- Companies on the long-term tend to produce more jobs, and contribute greater to the Gross Domestic Product (GDP)
Linking. Article flow of information was good, evidence provided is strong and well-studied. A significant number of companies was included in the index evaluation. The arguments set on the data observations are logic and substantiated.
Case Study: GlaxoSmithKline financial analysis
GlaxoSmithKline, PLC (GSK), is a Fortune Global 500 company, position 290 in 2018 pol (Fortune Global, 2019). The company is a global company with headquarters in England, UK. GSK specializes in three (3) health care core businesses in vaccines, pharmaceuticals, and consumer health care products (MarketLine Company Profile, 2018).
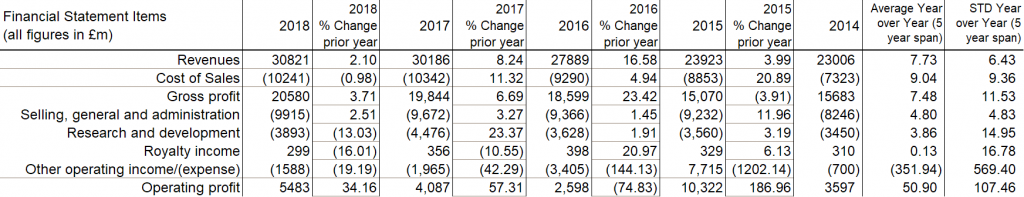
The company financial stance is clearly one of a growing company. Analysis of the company revenues, operating margin, and net profits year by year confirms an adequate growth stance (GSK Annual and Financial Report, 2018). Table 1 shows a composite of the financial statements for GSK for a period of 5 years including 2018 (Annual reports, 2018, 2015, 2012, Press Release, 2019). The following highlights can be derived from the financial data presented in GSK annual reports.
- On a 10 years basis, GSK showed an improvement of revenues grow in the last 5 years, showing consistent growth within the range of 2.1 to 16.58 % increase year over year
- On a 10 years basis, GSK showed a negative growth trend reversed in the gross profit growth, where year over year since 2015 increases in gross profit were observed between 3.71 % to 23.41 % within the last 5 years.
- Although the R&D spending can’t be directly associated to growth with the information provided, it can be argued that the consistent spending in R&D with as substantial increase in prior years (2009 to 2010 with an increase of 8.55 %), may be correlated to the sustained growth in revenues and gross profit observed in the last 5 years
The information collected from the annual reports income statements it can be observed that GSK showed an improved revenues and gross profit figures that maybe related to prior years R&D investments. A plausible explanation for the observed latest growing trend in GSK revenues and gross profit can be that GSK pipeline of products is robust and they have a business model with a strong stance on differentiation, innovation and collaborations for growth (MarketLine SWOT analysis, 2018).
Conclusion
The information provided in the articles included in this discussion provides a good understanding of the financial landscape of the latest years. Considerations of using the lower cost of capital opportunity that represents the current financial landscape were discussed in each of the three articles. Most of the recommendations given by the articles authors call into taking advantage of such opportunities by investing in business growth opportunities, both in the short as well as in the long-term plans. It was nicely show that investing in the with a long-term strategic vision in an environment where cost of capital is low, should serves the purpose of expanding profitability of the company. The case of GSK provided indications that investing in R&D activities over a span of 10 years resulted in a positive growth trend over the last 5 years, which tend to indicate a correlation between this type of investment and company revenue and profit growth.
References
Battersby, M. E. (2013). Funding your business expansion. Convenience Store Decisions, 24(10), 130–134.
Barton, D., Manyika, J., & Williamson, S. K. (2017) Finally, proof that managing for the long term pays off. Harvard Business Review Digital Articles, 2–8.
Fed Prime Rate (2019). Federal prime rate history. FedPrimeRate.com. Retrieved from: http://www.fedprimerate.com/wall_street_journal_prime_rate_history.htm#current
GSK Annual Report (2018). GlaxoSmithKline PLC annual report for 2017. Retrieved from, https://www.gsk.com/media/4751/annual-report.pdf
GSK Annual Report (2015). GlaxoSmithKline PLC annual report for 2014. Retrieved from, https://www.gsk.com/media/2711/annual-report-2014.pdf
GSK Annual Report (2012). GlaxoSmitKline PLC, annual report for 2011. Retrieved from, https://www.gsk.com/media/2696/annual-report-2011.pdf
GSK Full Year Report (2018). GlaxoSmithKline PLC full year and fourth quarter report. Retrieved from, https://www.gsk.com/media/5287/fy-2018-results-announcement.pdf
Mankins, M., Harris, K., & Harding, D. (2017) Strategy in the age of superabundant capital. Harvard Business Review, 95(2), 66–75.
McKinsey Global (2017). When companies with a long-term view outperform their peers. McKinsey & Company. Retrieved from: https://www.mckinsey.com/featured-insights/long-term-capitalism/where-companies-with-a-long-term-view-outperform-their-peers